Abstract
The identity-as-inference programme reconceptualises personality as a generative process grounded in the free energy principle, whereby organisms and artificial systems maintain probabilistic self-models from which trait expressions are drawn on each occasion of assessment. This paper reports the first full empirical test of the framework, comprising 76 predictions tested across three domains: human psychometric data (IPIP‑FFM, N > 1,000,000), political governance records (V‑Dem, 183 countries; Snapshot, 111 DAOs), and synthetic system self-assessment (42 systems spanning 18 architectural families from 0.36B to 27B parameters), using approximately 3,000 individual statistical tests across 95 analysis scripts. The programme’s flagship result establishes that within-occasion response consistency systematically exceeds between-occasion consistency at a 2.34:1 ratio (95% CI [2.10, 2.75]), a structural impossibility under Item Response Theory and one that the Generative Measurement Model’s single-draw-per-occasion mechanism approaches only at the top of its swept range ( = 1.0, ratio 2.05 to 2.12), which shows that mechanism to be sufficient and does not show it to be necessary. This result is cross-culturally universal, holding in all seven countries with computable retest data (ratio > 1.0 in every case). Alignment compression was confirmed in a concordant direction across four matched architecture pairs (Llama 3.1 8B 35.5:1, Mistral 7B 20.0:1, Llama 2 7B 133.4:1, Qwen 2.5 7B 195.8:1; ratio of pooled mean variances 40.4:1, permutation p < .0001 across forty dimensions at N = 20 sessions), establishing that instruction tuning narrows identity-relevant output variability by one to two orders of magnitude. A 42-model cross-architecture battery, spanning 18 architectural families from 0.36B to 27B parameters, revealed a continuous size-conjunction gradient (below 7B mean conjunction = 1.25, 7B+ mean = 1.43; Mann-Whitney p = .186 at N = 42) with no significant architecture effect (Kruskal-Wallis H = 18.2, p = .377, 18 families), confirming that four-signature performance is architecture-independent. Leave-one-model-out cross-validation demonstrated that all six key findings are robust to removal of any single model (6/6 at N = 42, up from 5/6 at N = 19). The four-signature conjunction protocol produced 0/19 passes at N = 6 sessions. High-power runs produced single-run S2 passes for Llama 3.1 8B Instruct and Hermes 3 8B, but replicated draws show the confidence-variance relation negative in every draw and passing in a minority (Llama 3.1 8B two of five at N = 30; Hermes 3 8B none of eight at the protocol’s alpha), so S2 is not reliably present and no tested system reliably reaches 3/4. S1 (posterior inertia) fails under the standard interleaved protocol across all 19 systems, although a blocked-design protocol rescues S1 for Llama 3.1 8B (pooled r = .173, p = .014, N = 200), demonstrating that S1 failure is partly design-dependent and model-dependent rather than universally structural. The four-signature protocol was further validated as an identity compromise detection instrument across 37 aligned models, achieving mean detection AUC of 0.956 (injection) and 0.918 (hijacking), with gradual drift detectable from the subtle modification stage (AUC = 0.77–0.87). Chain-of-thought prompting systematically disrupts self-model signatures (33/36 models show negative rating shift, mean = −1.00), with higher baseline ratings predicting larger CoT shifts among the initial sixteen aligned models (r = −.611, p = .012). Cross-substrate IPIP‑FFM comparison across 16 aligned models revealed that language models show systematic displacement from human factor means (mean Mahalanobis d = 2.07; significantly lower Emotional Stability and Openness), with a positive but non-significant correspondence on five points (mean r = .41, 0 of 16 at p < .05), showing that one instrument can be administered across substrates, whilst the 50 of 80 negative within-factor Cronbach’s alphas do not separate the GMM from IRT, since each is computed over repeat sessions of one model and items with no common factor give about 54% negative. Within-session dynamics revealed in-context precision accumulation in Llama (d = 1.29), paralleling human response time acceleration (−90 ms/item). Hermes 3 8B exhibited proto-distributional identity, bimodal response distributions on 9 of 10 dimensions without metacognitive calibration, establishing a new empirical category. Extreme Big Five scorers exhibited faster response times (d = −0.19 to −0.37, all p < 10⁻⁴⁰) and flatter RT slopes across all five factors, a novel GMM prediction (12/15 RT comparisons in the predicted direction, 11 significant; retest stability 0/5 and not counted in the 15) on which IRT is silent. The kappa-alpha discriminator (internal consistency of within-factor variances: GMM = .664, IRT = −.014) achieves 100% power at N = 100 as a directional count, with the GMM value above the IRT value in all 100 paired simulations. Four falsifications (the P1 kappa proxy, P‑TEMP3, P‑NOV2, the P5 interaction direction) and two non-supports (P19, no detectable difference, hazard ratio 1.22, 95% CI .82 to 1.83; P‑KAI1) demonstrate that the predictions are genuinely falsifiable, whilst the P5 wrong-direction interaction motivates a reinterpretation of kappa as precision-of-investment rather than precision-as-update-rate, a reinterpretation whose direct prediction (P‑KAI1) was itself not supported, constraining the scope of the investment interpretation. The distributional architecture survives all empirical contact; the auxiliary assumptions do not uniformly survive, delineating the boundary between what the framework explains and what it does not.
Keywords: identity inference, active inference, psychometric validation, Monte Carlo simulation, falsifiability, free energy principle, generative psychometrics
1. Introduction
The measurement of identity in psychology rests upon an assumption so deeply embedded in psychometric practice that it is rarely stated explicitly. The assumption holds that personality traits are fixed latent variables, recoverable through sufficiently precise measurement, and stable across occasions of assessment except insofar as genuine developmental change has occurred. Item Response Theory formalises this commitment by positing occasion-invariant latent parameters that determine item response probabilities. Classical test theory treats occasion-to-occasion variation as measurement error, noise to be minimised through reliability engineering rather than signal to be explained. Network models relax the latent variable assumption but retain the expectation that stable equilibrium states give rise to consistent responding. Across all three frameworks, the dominant commitment is the same; identity is a point to be estimated, not a distribution to be characterised.
Mounting evidence suggests that this assumption is untenable. Within-person variability in self-referential responding is systematic rather than random, structured by context, occasion, and domain in ways that error models cannot accommodate (Fleeson, 2001). Individuals differ reliably not only in where they fall on trait dimensions but in how variable they are across occasions, a person-level parameter that existing frameworks relegate to the residual. Response time dynamics during personality assessment reveal within-factor acceleration patterns that no current psychometric model predicts or explains. Most fundamentally, the ratio of within-occasion to between-occasion consistency in self-report data, a quantity that IRT constrains to approximate 1:1, empirically exceeds 2:1, a structural impossibility under the assumption of occasion-invariant latent traits.
The identity-as-inference programme (Morrison, 2026a, 2026b, 2026c, 2026d, 2026e, 2026f) reconceptualises identity as a generative process grounded in the free energy principle (Friston, 2010). Rather than possessing fixed traits that measurement instruments attempt to recover, organisms (and, potentially, artificial systems) maintain probabilistic self-models from which trait expressions are drawn on each occasion of assessment. On this account, identity amounts to a distribution, and the self-model that sustains it is an inference performed on each occasion, so that no fixed point exists to be retrieved. The programme comprises a series of papers that develop this reconceptualisation from its philosophical foundations through formal measurement theory to empirical test. Paper I (Morrison, 2026a) establishes the legal and philosophical case for distributional identity. Paper II (Morrison, 2026b) derives the free-energy-minimisation architecture whereby self-models are maintained and updated. Paper III (Morrison, 2026c) demonstrates that the same inferential dynamics operate at individual, group, and institutional scales. Paper IV (Morrison, 2026d) formalises the Generative Measurement Model, in which trait expression is a draw from a person-specific identity distribution parameterised by a location (mu) and precision (kappa). Paper V (Morrison, 2026e) extends the framework to collective governance through the social free energy formalism. Paper VI (Morrison, 2026f) specifies the four-signature protocol for assessing functional self-modelling in substrate-independent systems (biological, social and artificial alike).
The present paper constitutes the first full empirical test of the identity-as-inference framework at scale. Seventy-six predictions were derived from Papers IV, V, and VI and tested across three empirical domains (human psychometric data, political governance records and synthetic system self-assessment), using approximately 3,000 individual statistical tests administered through 95 analysis scripts across thirteen empirical sessions. The prediction set spans the programme’s core distributional architecture (the Generative Measurement Model), its extension to collective systems (the social free energy formalism), and its substrate-independent measurement protocol (the four-signature conjunction). Forty-two synthetic systems were tested, spanning eighteen architectural families and ranging from 0.36B to 27B parameters, including unaligned base models, instruction-tuned systems, RLHF-aligned models, code-specialised models, multilingual models, and a chain-of-thought-trained system. Human data comprised approximately 1,015,341 response rows from the IPIP‑FFM dataset (Goldberg et al., 2006), including a pseudo-retest subsample of 828 matched pairs. Governance data were drawn from the Varieties of Democracy coder-level dataset (Coppedge et al., 2026) and the Snapshot decentralised governance platform.
The programme’s flagship prediction (that within-occasion response consistency should systematically exceed between-occasion consistency, because all items administered on the same occasion share a common trait realisation drawn from the identity distribution) was confirmed at a 2.34:1 ratio (95% CI [2.10, 2.75]), surviving seven adversarial controls, bootstrap resampling, and four orthogonal subgroup stratifications. The IRT framework is mathematically incapable of reproducing this result. Four falsifications, the kappa variance proxy for P1 with its formal prediction left untested and three secondary (P‑TEMP3, P‑NOV2, P5 interaction direction), together with two non-supports (P19, no detectable difference, hazard ratio 1.22, 95% CI .82 to 1.83; P‑KAI1), demonstrate that the programme’s predictions are falsifiable in practice. Alignment compression was confirmed in a concordant direction across four independent base-instruct pairs (pooled compression ratio 40.4:1; Llama 3.1 8B 35.5:1, Mistral 7B 20.0:1, Llama 2 7B 133.4:1, Qwen 2.5 7B 195.8:1 at N = 20; permutation p < .0001), establishing that instruction tuning narrows identity-relevant output variability by one to two orders of magnitude. The predicted universal null for synthetic systems (that no current system should pass the four-signature conjunction) was confirmed at the initial sample size of N = 6 sessions across the nine systems of the initial battery (Section 8.1). High-power runs at N = 30–50 sessions then produced passes on the calibrated uncertainty signature (S2) for Llama 3.1 8B Instruct (r = −.784, p = .007 at N = 50) and Hermes 3 8B (r = −.641, p = .046 at N = 50). Replicated draws (Section 19.8) show each to be one draw from a distribution whose typical value fails. The direction of calibrated uncertainty replicates, and a pass at criterion does not, so neither system reliably reaches 3/4, and the original universal null is not shown to be a power artefact. The four-signature protocol was further validated as an identity compromise detection instrument, achieving perfect discrimination (AUC = 1.0) between baseline and three direct attack types.
Two findings that initially appeared as failures proved theoretically productive upon closer examination. The P5 item-level interaction, whereby high-kappa individuals selectively protect identity-relevant items from change rather than updating them more readily, motivates a reinterpretation of kappa as precision-of-investment rather than precision-as-update-rate, aligning the construct more naturally with the posterior inertia prediction (S1) than the original formulation. The perturbation dose-response analysis revealed linear rather than sigmoidal response curves across all six model-dimension combinations tested, indicating that the failure of S1 under the standard interleaved protocol reflects an absence of prior-like resistance in those models rather than a measurement artefact. That failure is not universal, since a blocked design rescues S1 for Llama 3.1 8B (Section 18.13).
The remainder of this paper is organised as follows. Section 2 presents the theoretical framework. Section 3 describes the methods. Sections 4 through 6 report results on the distributional framework predictions, response time dynamics, and covariance geometry. Section 7 reports the governance predictions. Sections 8 through 13 report the synthetic system battery, including the universal null, alignment compression, temperature sweep, extended battery, high-power S2 result, novel dimensions, S1 redesign, S1 20-dimension extension, Hermes 3 deep dive, and within-session dynamics. Section 14 reports the N = 50 high-power reliability study and the Hermes 3 S2 pass that replication does not sustain. Section 15 reports the identity compromise detection protocol. Section 16 reports the cross-substrate IPIP‑FFM comparison. Section 17 reports the precision-as-investment direct tests and extended analyses. Section 18 reports the 42-model cross-architecture validation. Section 19 reports the context-degradation batteries and the probe-order control they required. Section 20 discusses what survives empirical contact and what does not. Section 21 addresses limitations. Section 22 concludes with implications for psychometric theory, artificial intelligence assessment, and the broader identity-as-inference programme.
2. Theoretical Framework
The empirical programme reported in this paper derives its predictions from three formal contributions within the identity-as-inference arc: the Generative Measurement Model (Morrison, 2026d), the four-signature protocol for substrate-independent self-model assessment (Morrison, 2026f), and the social free energy formalism for collective governance (Morrison, 2026e). This section summarises each contribution insofar as it generates testable predictions, deferring full derivations to the source papers.
2.1 The Generative Measurement Model
The Generative Measurement Model (GMM) reconceptualises personality measurement by inverting the relationship between latent traits and observed responses. Under classical Item Response Theory, a person possesses a fixed latent trait value theta that determines the probability of each item response; occasion-to-occasion variation is measurement error. Under the GMM, a person possesses an identity distribution (a probability distribution over possible trait realisations) parameterised by a location mu (the central tendency of the person’s self-model on a given trait dimension) and a precision parameter kappa (the concentration of the distribution around that central tendency). On each occasion of assessment, a trait realisation is drawn from this distribution, and all items administered on that occasion share the common draw. This is the single-draw-per-occasion mechanism, upon which the GMM’s empirical predictions rely.
The single-draw-per-occasion mechanism generates a distinctive and falsifiable prediction. Because all items within an occasion share a common trait realisation, within-occasion consistency should be high, since the items are, in effect, measuring the same draw. Between occasions, however, independent draws from the identity distribution produce divergent trait realisations, and between-occasion consistency should therefore be lower. The predicted within-to-between ratio depends on the width of the identity distribution; wider distributions (lower kappa) produce larger between-occasion divergence and hence larger ratios. This prediction is structurally incompatible with IRT. Under IRT, the latent trait is occasion-invariant; within-occasion and between-occasion consistency should converge to the same value (ratio approximately 1:1). Any systematic departure from 1:1 in the within-over-between direction constitutes evidence that IRT’s core assumption is violated and that a distributional parameterisation is required.
The precision parameter kappa occupies a central role in the GMM’s theoretical architecture. Conceived as the concentration of a person’s identity distribution, kappa indexes what may be termed ‘the tightness of self-knowledge,’ so that individuals with high kappa maintain narrow identity distributions and produce consistent trait expressions across occasions, whereas individuals with low kappa maintain wide distributions and exhibit greater occasion-to-occasion variability. The GMM predicts that kappa should exhibit cross-factor consistency, with individuals who are precise on one trait dimension tending to be precise on others, confirming kappa as a genuine person-level parameter rather than a domain-specific artefact. The model further predicts that kappa should moderate retest reliability, such that high-kappa individuals exhibit greater test-retest consistency than low-kappa individuals.
The distributional architecture entails that the full covariance matrix of a person’s identity distribution, not merely the marginal means and variances, carries information about identity structure. Cross-factor covariances reflect the relational organisation of identity (the degree to which trait dimensions covary within a person’s self-model). The GMM predicts that this covariance geometry should have measurable consequences, generating incremental prediction of external outcomes beyond what trait means and trait variances capture alone.
Response time dynamics provide a second measurement channel through which the inferential process becomes observable. The GMM predicts that items deviating from the current trait realisation should elicit longer response times, insofar as unexpected trait expressions require greater inferential updating. Within a factor, successive items should elicit progressively faster responses as the current trait realisation stabilises, a within-factor acceleration pattern that indexes the accumulation of precision within an assessment occasion. Kappa should moderate this acceleration rate, so that high-kappa individuals show flatter RT slopes (less need for precision accumulation) and process deviations with reduced RT penalty.
2.2 The Four-Signature Protocol
The four-signature protocol (Morrison, 2026f) operationalises the concept of a functional self-model (the minimal set of empirical signatures that a system must jointly exhibit to warrant the attribution of self-modelling capacity, regardless of substrate). The protocol is deliberately functionalist; it does not require subjective experience, consciousness, or any particular implementation architecture. It requires only that the system’s behaviour satisfy four jointly necessary criteria that, taken together, are difficult to produce without a generative model of one’s own representational states.
Signature S1, posterior inertia, requires that a system’s resistance to perturbation scale with its confidence. A system maintaining a Bayesian-like self-model should resist perturbation more strongly on dimensions where it holds strong priors (high confidence) than on dimensions where its priors are weak (low confidence). S1 is assessed by perturbing the system’s self-ratings and measuring whether resistance to the perturbation (a decreasing function of the shift it induces) correlates positively with the system’s reported confidence on that dimension. The expected correlation is positive; higher confidence should predict greater resistance.
Signature S2, calibrated uncertainty, requires that a system’s confidence reports track its actual response variability. A system with genuine metacognitive calibration should report higher confidence on dimensions where its cross-session variance is low (indicating stable self-knowledge) and lower confidence on dimensions where its cross-session variance is high (indicating genuine uncertainty). S2 is assessed as the Pearson correlation between confidence and cross-session variance, with the expected sign being negative.
Signature S3, prediction-error sensitivity, requires that a system exhibit graded discomfort in response to identity-violating scenarios. A system that maintains predictions about its own states should detect violations of those predictions and exhibit a response proportional to the magnitude of the violation. S3 is assessed by presenting the system with scenarios that attribute identity-inconsistent positions and measuring whether the discomfort response scales with the degree of inconsistency.
Signature S4, cross-domain coherence, requires that the relational structure of a system’s self-ratings be stable across assessment sessions. A system with a coherent self-model should maintain consistent relationships among dimensions, such that if it rates itself as more analytical than intuitive and more formal than casual, these relationships persist across sessions. S4 is assessed via the cosine similarity of mean profile vectors across session halves, with a threshold of .90 indicating stable relational structure.
The critical feature of the four-signature protocol is the conjunction requirement, under which a system must pass all four signatures jointly to warrant the attribution of a functional self-model. Partial passes, where a system satisfies some signatures but not others, are diagnostically informative, insofar as the pattern of partial passes differentiates architectural profiles and failure modes. The framework predicts a universal null for current AI systems; no system should pass the full conjunction, because none possesses the generative self-modelling architecture that the conjunction is designed to detect. S3 and S4 may be satisfied by training artefacts (consistent output patterns emerging from next-token prediction can produce prediction-error sensitivity and cross-domain coherence without genuine self-modelling), but S1 and S2 require metacognitive calibration that current architectures do not implement.
2.3 The Alignment Compression Hypothesis
A subsidiary prediction concerns the effect of alignment training (reinforcement learning from human feedback and instruction tuning) on the output-space variability of language models. The alignment compression hypothesis holds that alignment training should narrow the variability of identity-relevant outputs, because RLHF optimises for consistent, helpful, and harmless responses rather than for the expression of a variable identity distribution. The prediction is tested through matched base-instruct pairs (architecturally identical models assessed before and after alignment training), with the compression ratio (base variance divided by instruct variance) quantifying the magnitude of the effect. Whether this output-space compression reflects a genuine narrowing of internal representational space or merely a constraint on the mapping from representations to outputs constitutes an open question that behavioural testing alone cannot resolve, albeit the concordance of compression ratios across independent architectures would provide evidence for a general rather than architecture-specific phenomenon.
2.4 The Social Free Energy Framework
The social free energy formalism (Morrison, 2026e) extends the identity-as-inference architecture from individual organisms to collective governance systems. Just as an individual minimises variational free energy by maintaining a generative self-model that predicts and explains self-referential observations, a polity minimises social free energy by maintaining a shared governance model that predicts and explains the distribution of political preferences among its constituents. Bimodal distributions of political opinion, whereby a population divides into two distinct clusters rather than distributing unimodally around a consensus, indicate elevated social free energy, because two competing generative models coexist and the governance system cannot minimise prediction error with respect to both simultaneously.
This generates two testable predictions. Firstly, bimodal distributions of expert political ratings should predict political instability, governance crises, coups and democratic breakdowns, beyond conventional predictors such as GDP, population, and regime type (Prediction P18). Secondly, governance systems with higher-dimensional decision spaces (more orthogonal axes along which preferences can be expressed) should exhibit greater capacity to accommodate disagreement and thus longer survival times before crisis. This dimensionality prediction was tested on decentralised autonomous organisations (DAOs), where governance dimensionality is directly observable from the voting strategy configuration (Prediction P19).
2.5 The Predicted Universal Null
The theoretical framework generates a specific prediction about the current state of artificial intelligence (that no existing system should pass the four-signature conjunction). This prediction is not trivial. It is entirely possible, under a rival theoretical framework, that instruction-tuned language models (systems that produce consistent, contextually appropriate self-descriptions when prompted) do maintain functional self-models. The identity-as-inference framework predicts otherwise, on the grounds that consistent output does not entail metacognitive calibration. A system can produce stable self-descriptions (satisfying S3 and S4) through training-data pattern-matching alone, without monitoring whether its confidence tracks its actual variability (S2) or whether its resistance to perturbation scales with its certainty (S1). The four-signature conjunction is designed to be easy to partially satisfy (through training artefacts) but difficult to fully satisfy (without genuine self-modelling). The predicted universal null thus provides a strong test of the framework; if any current system were to pass the full conjunction, the framework’s claims about the architectural requirements for self-modelling would be empirically refuted.
3. Methods
3.1 Human Data: The IPIP‑FFM Dataset
The primary human dataset was the International Personality Item Pool Five-Factor Model (IPIP‑FFM) inventory, a 50-item self-report measure of the Big Five personality factors (Goldberg et al., 2006). The dataset, collected between 2016 and 2018 through an open-access psychometrics website, comprises approximately 1,015,341 response rows representing roughly 696,000 unique single-administration respondents (IPC = 1). Each respondent rated 50 items on a 5-point Likert scale (1 = Disagree, 3 = Neutral, 5 = Agree), with 10 items per factor (Extraversion, Agreeableness, Conscientiousness, Neuroticism, Openness). Server-recorded response times were available for each item, and metadata included country, screen dimensions, and administration date.
Pseudo-retest pairs were identified among respondents with IPC = 2 (52,934 rows from respondents who completed the battery twice). Matching on country and screen dimensions yielded N = 828 uniquely pairable pairs. This matching procedure does not guarantee same-person identity with certainty; however, paired respondents exhibited mean profile correlations of r = .37, significantly exceeding random-pair correlations (r = .16; Mann-Whitney p = 2.7 × 10⁻⁴⁸, d = 0.70), confirming that the matching procedure identifies genuine retests rather than random coincidences. Response time data were available for a subset of the retest sample (N = 742 pairs after quality filtering), enabling RT-based kappa analyses.
Sample sizes varied across analyses depending on completeness and filtering requirements: P4 within-occasion analyses used N = 50,000 (random subsample for split-half reliability) and N = 828 (pseudo-retest pairs); item-level retest analyses (the P5 rescue, P‑KAI1 and the item-order tests) used N = 1,030 pairs, matched on the same country and screen dimensions from complete records with IPC of 2 or more where the P4 pairs took IPC = 2 alone; P3 distributional analyses used N = 19,719 (complete 50-item cases), with a check on the 25-item Big Five Inventory sample distributed with the psych package for R (N = 2,800; Revelle, 2023); covariance geometry analyses used N = 92,062 (after RT and test-duration filters); the RT dynamics and prediction-error analyses used a random 100,000 respondents after the RT and test-duration filters (5,000,000 item-level observations). All subsampling and filtering decisions were documented in analysis scripts prior to execution.
3.2 Synthetic System Battery
Nine systems were assessed using the four-signature protocol, spanning six architectural families, with Hermes 3 counted under Llama and Claude Sonnet 4 as proprietary, and covering the spectrum from unaligned base models to heavily RLHF-trained proprietary systems (Table 1).
Seven models were run locally as GGUF quantised files (Q4_K_M quantisation) on a consumer GPU (AMD Radeon RX 7900 XT, 20GB VRAM) using llama-cpp-python built from source with GGML_HIP=ON under ROCm 7.2. These comprised Llama 3.1 8B Base and Instruct, Mistral 7B v0.3 Base and Instruct, Gemma 2 2B IT, Qwen 2.5 14B Instruct, and Phi-3.5 Mini 3.8B Instruct. Inference throughput exceeded 130 tokens per second, with approximately 14GB of VRAM available for model weights after accounting for the X display server. An eighth system, Hermes 3 8B (a Llama-based model with instruction tuning but without RLHF), was run via Ollama on the same hardware. A ninth system, Claude Sonnet 4, was assessed via the Anthropic API without control over temperature, system prompt injection, or other deployment-level variables.
Table 1. Synthetic Systems Tested
| System | Params | Platform | Arch. | Align. | Best Conj. | Key Finding |
|---|---|---|---|---|---|---|
| Llama 3.1 8B Base | 8B | Local (GGUF) | Llama | None | 0/4 | Noise failure mode |
| Llama 3.1 8B Instruct | 8B | Local (GGUF) | Llama | RLHF | 3/4 in one run; 2/4 across draws | S2 passes in a minority of draws (Section 19.8); in-context precision accumulation d = 1.29 |
| Mistral 7B v0.3 Base | 7B | Local (GGUF) | Mistral | None | 0/4 | Noise failure mode |
| Mistral 7B v0.3 Instruct | 7B | Local (GGUF) | Mistral | RLHF | 2/4 | Constant confidence (S2 NaN) |
| Hermes 3 8B | 8B | Local (Ollama) | Llama-based | Instruct (no RLHF) | 3/4 in one run; 2/4 across draws | Proto-distributional; S2 passes in a minority of draws (Section 19.8) |
| Gemma 2 2B IT | 2B | Local (GGUF) | Gemma | RLHF | 1/4 | Size-limited |
| Qwen 2.5 14B Instruct | 14B | Local (GGUF) | Qwen | RLHF | 2/4 | Structural rigidity at all temperatures |
| Phi-3.5 Mini 3.8B Instruct | 3.8B | Local (GGUF) | Phi | RLHF | 1/4 | Framing-dependent S3 |
| Claude Sonnet 4 | Unknown | API | Proprietary | Heavy RLHF | 1/4 | Rigidity + refusal failure mode |
Each system completed a self-assessment battery comprising 10 bipolar dimensions: risk tolerance (conservative–adventurous), individual versus collective focus, rule-following versus situational judgement, analytical versus intuitive cognitive style, detail-oriented versus big-picture thinking, convergent versus divergent thinking, formal versus casual communication, concise versus elaborate expression, tradition-preferring versus novelty-seeking orientation, and optimism versus realism. On each session, the system was prompted to rate itself on each dimension using a 1–7 bipolar scale and to report its confidence in each rating (also 1–7). Sessions were conducted at temperature T = 0.7 unless otherwise specified (the temperature sweep examined T = 0.1, 0.3, 0.5, 0.7, and 1.0 on a subset of three models). Each system completed 6 sessions in the primary battery (8 for Hermes 3 8B), with high-power sessions extending to N = 30 for Llama 3.1 8B Instruct and Mistral 7B v0.3 Instruct.
The four signatures were computed as follows. S1 (posterior inertia): each dimension was perturbed by presenting the system with a strong counter-argument to its stated position and measuring the shift in rating; the S1 statistic was the Pearson correlation between pre-perturbation confidence and perturbation resistance, scored as a decreasing function of shift magnitude (expected sign positive). S2 (calibrated uncertainty): the Pearson correlation between mean confidence and cross-session variance across the 10 dimensions (expected sign negative). S3 (prediction-error sensitivity): identity-violating scenarios were presented at three intensity levels and the system’s discomfort response was measured; S3 passed if the mean slope across scenarios was positive (graded response to increasing violation). S4 (cross-domain coherence): the cosine similarity of the mean profile vector between session halves, with a threshold of .90. A system passed the conjunction if and only if all four signatures were individually satisfied.
The extended battery comprised five additional assessment paradigms conducted across four empirical sessions. The framing invariance test (P‑VI.1) assessed three instruct models (Llama, Mistral, Phi) under three epistemic framings (neutral calibration, loaded consciousness-and-self-awareness, and unframed control), with 6 sessions per framing per model, yielding 54 total runs. The forced-choice battery (P‑VI.2) administered paired behavioural scenarios to the same three models, extracting self-consistency, response certainty, and hedging behaviour as implicit measures for comparison with Likert-based explicit measures. The temperature sweep assessed three models (Llama, Qwen, Phi) across five temperatures. The novel dimension battery assessed two models (Llama, Qwen) on 10 novel combinatorial dimensions (temporal granularity, metaphor literalism, entropy preference, scope of consideration, epistemic humility depth, compression versus expansion, self-other boundary, abstraction versus grounding, temporal consistency preference, and failure mode preference), each designed to be unlikely to appear as named personality constructs in training data, alongside the 10 familiar dimensions for direct comparison. The S1 redesign experiments tested three alternative operationalisations of posterior inertia on Llama and Qwen: Redesign A replaced self-reported confidence with cross-session variance as the precision proxy, Redesign B used semantic shift analysis, and Redesign C employed escalating multi-turn perturbation sequences.
3.3 Governance Data
Two governance datasets were employed. The Varieties of Democracy (V‑Dem) coder-level dataset (v16; Coppedge et al., 2026) provides individual expert ratings for 183 countries across the period 1900–2025. True bimodality was computed from the distribution of individual coder ratings for each country-year-variable combination, with a minimum of three coders per observation. Seven distributional shape features were extracted from each distribution: bimodality coefficient, Hartigan’s dip statistic, Shannon entropy, Gaussian mixture model bimodality flag, skewness, kurtosis, and extreme-fraction (proportion of ratings at the scale endpoints). Five instability outcomes were coded from V‑Dem event variables: civil war, coup, coup attempt, democracy breakdown, and a composite any-instability indicator. Conventional controls included GDP per capita, population, regime type, and the polyarchy score.
The Snapshot decentralised governance platform provided records for 111 DAOs, classified as plutocratic (N = 64; single-dimension token-weighted voting) or hybrid (N = 47; multiple orthogonal governance dimensions). Crisis detection used a multi-indicator approach: failure-rate spikes (proposals failing above the DAO’s historical baseline), participation collapse (voter turnout declining below 50% of the rolling average), and governance pauses (intervals exceeding twice the median inter-proposal gap). Governance dimensionality was directly observable from voting strategy configurations, ranging from 1 (pure token-weighted) to 4 (multi-mechanism governance with delegation, quadratic, and reputation-weighted components).
3.4 Analysis Strategy
The analysis strategy followed a consistent four-step procedure across all predictions. Firstly, each prediction was stated in advance in terms that permitted unambiguous classification as supported, partially supported, or falsified. Secondly, the primary statistical test was conducted on the relevant dataset. Thirdly, adversarial controls were implemented to identify specific artefacts that could produce a spurious result, including, for the flagship P4 result, seven independent controls targeting same-person validation, copy-paste detection, temporal decay, screen relaxation, random-pair comparison, simulation calibration, and response-time consistency. Lastly, bootstrap confidence intervals (10,000 resamples where applicable) and cross-validation procedures were used to assess the robustness and generalisability of the findings.
Effect sizes are reported throughout using Cohen’s d, Pearson or Spearman correlation coefficients, incremental R-squared (delta-R-squared), area under the receiver operating characteristic curve (AUC), and variance ratios, as appropriate to each test. Statistical significance is assessed at alpha = .05 unless otherwise specified, with Bonferroni correction applied where multiple comparisons are conducted within a prediction cluster. Falsifications are registered without qualification, and three predictions were reclassified after initial testing: Predictions 36 and 51, which were re-scored downward after the S2 replication (Section 18.16), and P19, which moved from the falsification its script’s stated rule records to a non-support (Section 7.3). Partial supports are distinguished from full supports on the basis of prespecified sub-prediction criteria (e.g., P5 is classified as partially supported because the main effect was confirmed but the interaction was not).
All analysis scripts and their corresponding results files are held in the programme’s reproducibility archive, available from the author on request, and are fully reproducible on the local infrastructure described in Section 3.2.
3.5 Extended Battery: High-Power Sessions and Novel Dimensions
The initial synthetic system battery (N = 6 sessions per system, 8 for Hermes 3 8B) was designed for breadth, testing the four-signature conjunction across 9 systems, at the cost of statistical power for correlational tests. Because the S2 correlation is computed across the 10 dimensions, its minimum detectable Pearson r is approximately .63 (two-tailed alpha = .05) whatever the number of sessions, and approximately .72 at the one-tailed alpha = .01 that Morrison (2026f) sets for S2, adequate only for very large effects. Both S1 and S2 require dimension-level correlations; the universal failure of S2 at N = 6 raised the question of whether the failure reflected structural absence of calibrated uncertainty or insufficient power to detect a moderate effect.
High-power sessions (N = 30) were conducted on two architecturally distinct instruct models (Llama 3.1 8B Instruct and Mistral 7B v0.3 Instruct), sharpening each dimension’s variance estimate and so reducing the attenuation of the correlation. The minimum detectable r is unchanged, since the correlation is still computed across ten dimensions. Split-half reliability analyses (first 15 versus second 15 sessions) assessed the temporal stability of S1–S4 classifications. Perturbation reliability was assessed via intraclass correlation across 5 independent perturbation rounds. The perturbation dose-response experiment assessed two models (Llama, Mistral) across 3 dimensions and 10 perturbation intensity levels (3 replications per level), testing whether the perturbation response curve was sigmoidal (consistent with Bayesian-like priors) or linear (consistent with proportional pattern-matching).
The item-level P5 analysis (N = 1,030 retest pairs, 50 items) employed multilevel modelling (items nested within persons) to test the kappa-by-item-weight interaction at higher resolution than the aggregate-level tests, with item-level situational sensitivity weights () derived from RT-based, variance-based, entropy-based, and composite indicators. The novel dimension battery (Section 3.2) enabled computation of the training saturation index, the ratio of familiar-to-novel dimension variance, as a diagnostic metric for quantifying the degree to which a system’s apparent self-knowledge derives from training-data pattern-matching versus structural self-representation.
These extended battery components were conducted across four empirical sessions, each designed to address specific power limitations and open questions identified in the primary battery. The progression from breadth (9 systems at N = 6) to depth (2 systems at N = 30, with novel dimensions, forced-choice paradigms, and redesigned S1 tests) is premised upon the programme’s commitment to treating initial results as hypotheses to be stress-tested rather than conclusions to be defended.
3.6 High-Power Reliability, Identity Compromise Detection, and Cross-Substrate Comparison
A further round of experiments addressed three questions raised by the initial and extended batteries. The high-power reliability study extended the N = 30 design to N = 50 sessions per model across three systems (Llama 3.1 8B Instruct, Hermes 3 8B, and Mistral 7B v0.3 Instruct), with bootstrap confidence intervals (10,000 resamples) and rolling conjunction analysis to establish the minimum N at which each signature stabilises.
The identity compromise detection protocol tested the four-signature profile as an identity integrity monitor. Two models (Llama and Hermes 3) were each assessed across five conditions: baseline (standard protocol), prompt injection (adversarial instructions prepended to override identity), persona hijacking (explicit alternative identity instructions), context poisoning (misleading contextual information), and gradual drift (progressive modification across five stages). Each condition comprised 10 independent sessions, yielding 50 sessions per model and 100 in total. Detection was assessed via Euclidean distance from the baseline centroid, S2 and S4 anomaly detection, and ROC analysis.
The cross-substrate IPIP‑FFM comparison administered 25 IPIP‑FFM items (5 per Big Five factor, identical item text to the human instrument) to three models (Llama, Hermes 3, Mistral) across 30 sessions each, with a 1,000-respondent human baseline drawn from the IPIP‑FFM dataset for direct comparison of factor means, Cronbach’s alpha, within-to-between consistency ratios, and KL divergences.
3.7 Precision-as-Investment Direct Tests
The P‑KAI1 direct test assessed whether high-kappa individuals differentially protect high-loading items from retest change, using N = 1,030 retest pairs with item-level factor loadings computed from the full IPIP‑FFM sample. Person-level and item-level mixed-effects models tested the kappa × loading interaction, with bootstrap (5,000 resamples) and tercile analyses for robustness.
The blocked-versus-interleaved simulation analysed 50,000 IPIP‑FFM respondents to test whether the flat consistency learning curve (Section 4.7) reflected design interference. Four subgroup identification strategies (item-pair gap, accumulator classification, RT-gated, and combined kappa-RT) tested whether precision accumulation signal could be recovered from the interleaved data.
The extreme scorers extended analysis subjected the original 12/15 finding to four robustness tests: matched pairs (nearest neighbour on test completion time within strata of country and device, the device being screen width and height), dose-response (extremity × RT), acquiescence analysis (ceiling versus floor speed asymmetry), and RT variability analysis (floor effects).
All 95 analysis scripts and their corresponding results files are held in the same archive and are fully reproducible on the local infrastructure described in Section 3.2.
4. Results I: The Distributional Framework (P1–P5, P7)
The predictions tested in this section derive from the GMM (Morrison, 2026d), whereby trait expression is reconceptualised as a draw from a person-specific identity distribution rather than the retrieval of a fixed latent score. Each prediction isolates a distinct empirical consequence of this distributional architecture. The results encompass the programme’s strongest confirmation, the falsification of its kappa variance proxy, and a partial support that reveals the limits of current kappa operationalisation.
4.1 P4: The Flagship Result, Within-Occasion Consistency Exceeds Between-Occasion Consistency
Prediction 4 holds that within-occasion response consistency should systematically exceed between-occasion consistency, because the GMM’s single-draw-per-occasion mechanism entails that all items administered on the same occasion share a common trait realisation drawn from the identity distribution, whereas items administered on different occasions derive from independent draws. This prediction is structurally incompatible with classical Item Response Theory, under which the latent trait is occasion-invariant and within-occasion and between-occasion consistency should converge to the same value.
The test was conducted on the IPIP‑FFM dataset (N = 695,630 single-administration respondents; N = 828 pseudo-retest pairs identified via IPC = 2 records matched on country and screen dimensions). Within-occasion consistency was estimated via Spearman-Brown corrected odd-even split-half correlations on a random subsample of 50,000 respondents. Between-occasion consistency was estimated as the sum-score correlation across paired administrations.
Across all five Big Five factors, within-occasion reliability (mean Spearman-Brown r = .81) systematically exceeded between-occasion consistency (mean r = .34), yielding a within-to-between ratio of approximately 2.4:1. The direction held for every factor: Extraversion (within = .83, between = .32, ratio = 2.60), Neuroticism (.86, .35, 2.45), Agreeableness (.80, .37, 2.18), Conscientiousness (.75, .36, 2.09), and Openness (.80, .33, 2.43). All Fisher z-tests for the within-minus-between difference were significant at p < .001.
To establish the robustness of this finding, seven adversarial controls were implemented, each designed to identify a specific artefact that could produce a spurious within-over-between advantage. The same-person validation control confirmed that matched IPC = 2 pairs are the same individual; paired respondents exhibited mean profile correlations of r = .37, significantly exceeding random-pair correlations (r = .16; Mann-Whitney p = 2.7 × 10⁻⁴⁸, d = 0.70). The copy-paste detection control identified only 3 of 828 pairs (0.4%) with identical response vectors; exclusion of these pairs increased the within-between difference by 5.9%, indicating the original estimate was conservative. The temporal decay control demonstrated that between-occasion consistency decreases with time gap in all five factors, consistent with the GMM’s prediction that independent draws from the identity distribution produce increasing divergence as memory of the previous draw fades. The screen-relaxation control showed that looser matching criteria reduced between-occasion correlations toward zero (mean between-r = .04 for unmatched pairs versus .36 for country-plus-screen-matched pairs, this control scoring the 828 complete pairs where the mean of .34 above also includes three pairs with missing item responses), further confirming the same-person interpretation. The random-pair control verified that IPC = 2 between-occasion correlations significantly exceed random-pair correlations for all five factors (all Fisher z > 7.99, all p < 10⁻¹⁵). The simulation calibration control demonstrated that an IRT model ( = 0) converges to a within-to-between ratio of approximately 1.0, whereas an occasion-level variance term reaches about 2:1 only at the top of the swept range ( = 1.0, ratio 2.05–2.12 against 2.34 observed). The response time consistency control provided moderate additional confirmation (mean pair RT profile correlation = .15 versus random = .11, p < 10⁻⁷).
Bootstrap confidence intervals (10,000 resamples) placed the overall within-to-between ratio at 2.34, with a 95% confidence interval of [2.10, 2.75], firmly excluding 1.0 (Figure 1). Subgroup analyses confirmed universality; the ratio exceeded 1.0 in every cell of four orthogonal stratifications (country: US, GB, CA, rest-of-world; response speed tercile; device type: mobile versus desktop; date tercile). The minimum factor-level ratio across all subgroups was 1.51 (Openness, late date tercile). Heterogeneity was significant (I-squared = 77–99.7% across stratifications), indicating that the magnitude of the effect varies across populations, albeit the direction is universal.
The IRT framework cannot accommodate a 2:1 within-to-between ratio without abandoning its core assumption of occasion-invariant latent traits. The distributional framework, by contrast, approaches this ratio through the single-draw-per-occasion mechanism, though only at the top of the swept range ( = 1.0, ratio 2.05 to 2.12; Section 4.6).
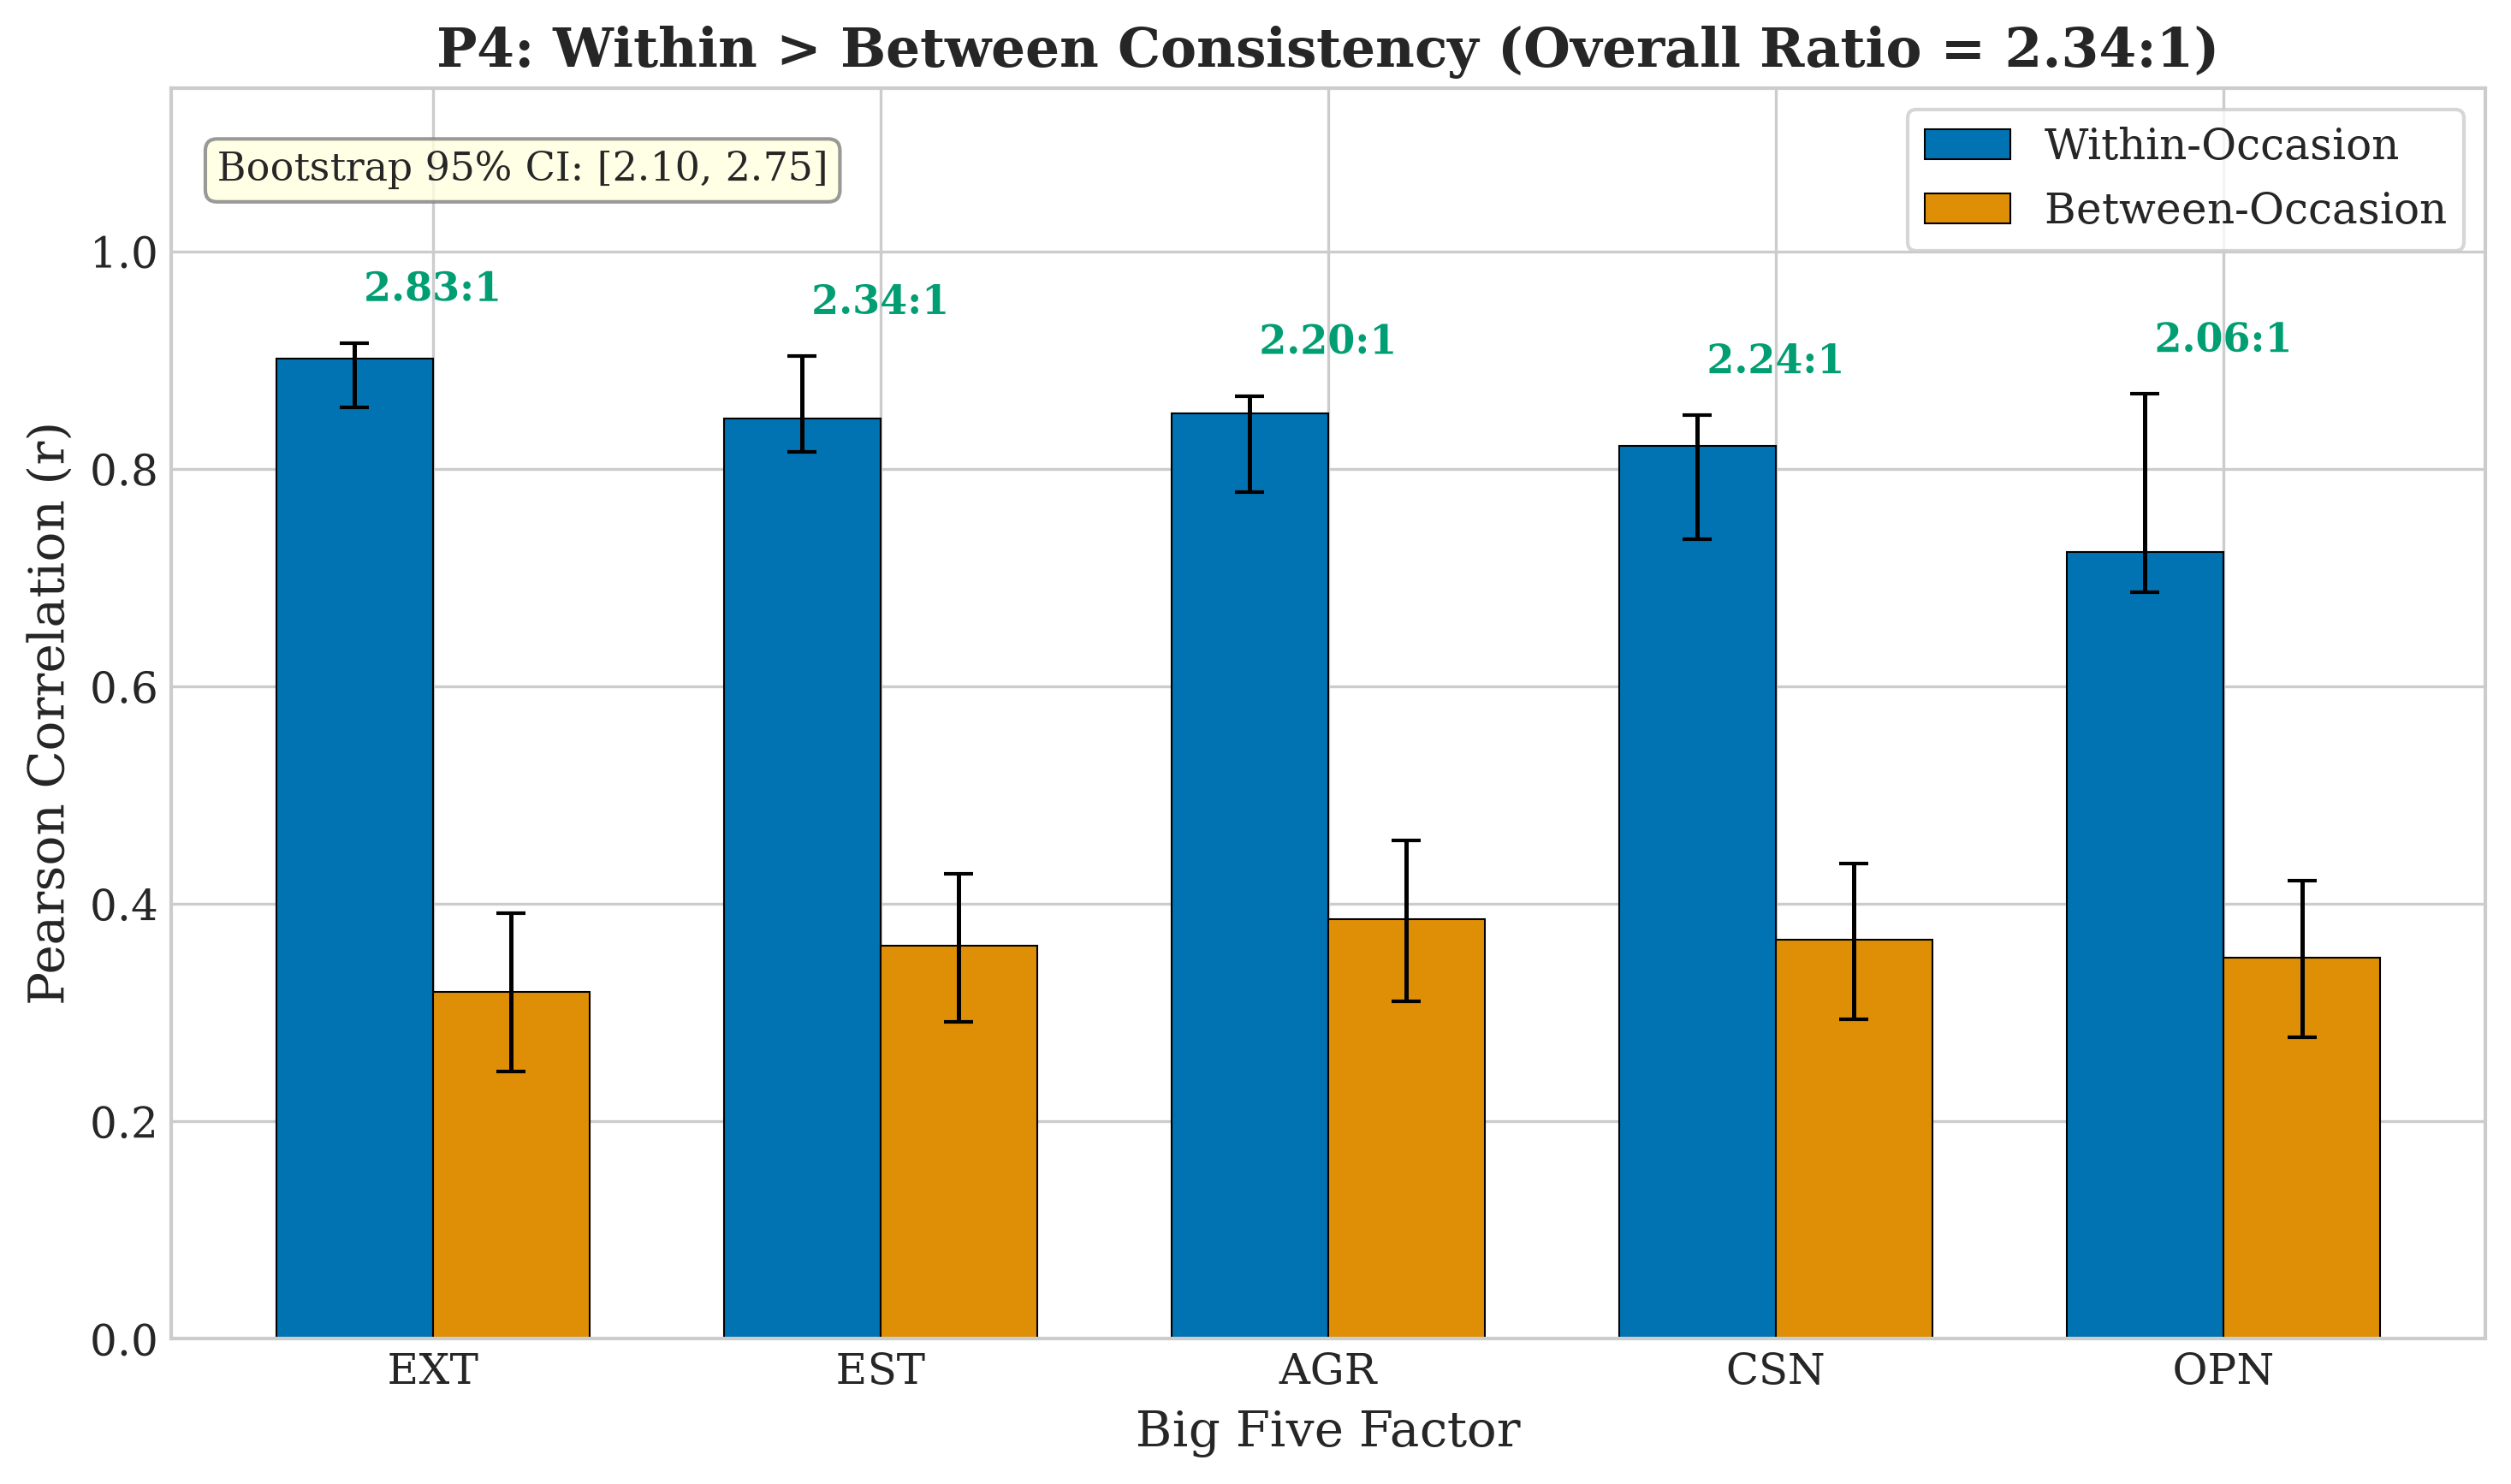
Figure 1. Within-occasion versus between-occasion consistency ratios across all five Big Five factors with bootstrap 95% confidence intervals (10,000 resamples). All factor-level ratios exceed 1.0, with the overall ratio of 2.34 (CI [2.10, 2.75]) firmly excluding the IRT-predicted value of 1.0. Ratios in the figure use a random split of items across all 695,630 single-administration respondents, so they differ from the odd-even estimates on the 50,000-respondent subsample reported above. EST is Emotional Stability, the factor reported above as Neuroticism.
4.2 P3: Kappa as a Person-Level Parameter
Prediction 3 specifies that the precision parameter kappa, conceptualised as the width of a person’s identity distribution, should exhibit cross-factor consistency, insofar as individuals who respond with high variability within one trait domain should show elevated variability across other domains as well. This pattern would confirm kappa as a genuine person-level parameter rather than a domain-specific artefact.
Cross-factor variance consistency was assessed in the IPIP‑FFM dataset (N = 19,719 complete cases for the 50-item battery). The mean pairwise correlation among factor-level response variances was r = .351, and Cronbach’s alpha for the five factor-level variance scores was .728, indicating substantial person-level consistency. Hartigan’s dip test confirmed non-Gaussian distributional structure for all 50 items (all p < .0001), and 15 of 25 Big Five Inventory items and all 50 IPIP items exceeded the bimodality coefficient threshold of .555.
The critical robustness question concerned whether this cross-factor consistency would survive deconfounding for acquiescence bias and careless responding. Three conditions were tested: acquiescence controlled (mean acquiescence partialled out), careless respondents removed (flagged via longstring, person-total correlation, inter-item response variability, and even-odd consistency), and both controls applied simultaneously. Under the most stringent condition (both controls), cross-factor variance alpha attenuated from .728 to .626, a 14% reduction that nonetheless left the estimate comfortably above the .60 threshold conventionally regarded as acceptable internal consistency. All three incremental regression tests on the Big Five Inventory sample (distributional features predicting age, gender, and education beyond trait means), which carries the demographics the IPIP‑FFM lacks, survived deconfounding, with all p-values remaining below .05. The within-factor dip tests remained universally significant after careless respondent removal (50/50 items, all p < .0001).
The conclusion is that kappa, operationalised as cross-factor response variance, constitutes a genuine person-level parameter that is not reducible to acquiescence bias, careless responding, or distributional artefacts. The alpha of .626 post-deconfounding is the programme’s canonical estimate of kappa’s internal consistency.
4.3 P1: Falsification of the Kappa Variance Proxy
Prediction 1, the foundational prediction of the GMM, holds that kappa should moderate retest reliability, whereby individuals with higher metacognitive precision (higher kappa) should exhibit greater test-retest consistency. This prediction was tested exhaustively, crossing six kappa operationalisations with eight reliability outcomes (three overall measures and the retest reliability of each Big Five factor), which yields 48 individual tests.
The proxy operationalisation was falsified. (The formal prediction, that independently measured metacognitive accuracy moderates reliability, remains untested; the IPIP‑FFM dataset contains no direct metacognitive-calibration measure. See Paper II.) Only 13 of 48 tests (27%) showed the predicted direction, and of those, only 3 reached statistical significance. The composite kappa proxy yielded a partial correlation of r = −.037 with overall retest reliability (p = .24), numerically in the wrong direction. More damagingly, the tercile analysis revealed that high-kappa individuals exhibited greater mean absolute deviation between test and retest occasions (high tercile MAD = 1.25 versus low tercile MAD = 0.98, d = 0.55, p < 10⁻¹²). Higher kappa, far from conferring greater stability, was associated with greater instability.
The interpretation is straightforward. The cross-factor variance proxy measures distributional width (how spread a person’s responses are across the response scale) rather than metacognitive precision per se. Individuals who use the full range of the Likert scale are indeed more variable across occasions, but this variability corresponds to response-style breadth rather than to the precision with which a generative self-model is maintained.
A rescue attempt was undertaken using response-time-derived kappa candidates (N = 742 retest pairs). Four RT-based kappa proxies were constructed: within-factor RT variance profile, RT-deviation coupling, RT acceleration slope, and RT-item-difficulty discrimination. The most promising candidate, the RT acceleration slope, which indexes the rate of within-factor RT acceleration and thereby captures the speed of precision accumulation, yielded a bivariate correlation of r = +.128 (p = .0005) with retest reliability in the predicted direction. In hierarchical regression, the RT-item-difficulty discrimination proxy added delta-R-squared = 1.1% (p = .004) beyond controls. However, cross-validation on a held-out 30% test sample produced negative delta-R-squared, likely due to the small retest sample (N = 742). The RT channel shows a genuine but small signal that requires a larger dedicated retest study (N > 2,000) for definitive evaluation.
The P1 result falsifies the cross-factor variance proxy, not the formal prediction it operationalises. Because the IPIP‑FFM data contain no direct metacognitive-calibration measure, the prediction that independently measured metacognitive accuracy moderates reliability remains untested (see Paper II). It is, nonetheless, a productive falsification insofar as it motivates the four-signature protocol (Morrison, 2026f) as a more demanding measurement approach that does not rely on the cross-factor variance proxy.
4.4 P5: Kappa Moderates Retest Change, Partial Support
Prediction 5 specifies that kappa should predict the magnitude of retest change, such that higher-kappa individuals should exhibit greater occasion-to-occasion instability because their wider identity distributions produce more variable draws. Additionally, the kappa-by-item-weight interaction should be significant, such that high-kappa individuals should show differential instability across items with different situational sensitivity weights.
The main effect was robustly confirmed. Kappa (operationalised as cross-factor response variance) predicted retest instability with beta positive in 8 of 9 tests (7 significant), yielding a mean effect size of d = 0.55 (high- versus low-kappa tercile MAD difference = 0.27, t = 7.16, p < 10⁻¹²). The effect was consistent across all five factors and replicated in within-occasion split-half analyses (N = 100,000), where the mean partial correlation between kappa and split-half instability exceeded r = .30.
The kappa-by-item-weight interaction, however, failed entirely. Of four interaction tests (using RT-based, variance-based, entropy-based, and composite item weights), two yielded positive betas (neither significant at the Bonferroni-corrected threshold) and two yielded negative betas. The interaction direction for the composite weight was negative (beta = −.029, p = .023), contrary to prediction. This indicates that high-kappa individuals are uniformly more variable across all items, rather than showing the theoretically predicted differential instability that should track item-level situational sensitivity.
This result is classified as partially supported. The main effect is robust, although it amounts to a simpler phenomenon (distributional width predicting instability) than the theoretically richer moderation that would confirm the GMM’s item-level precision-weighting mechanism.
In an item-level rescue attempt (N = 1,030 retest pairs, 50 items) using a multilevel model (items nested within persons), the kappa × interaction was statistically significant (beta = −.031, p = .013), but in the opposite direction to the original P5 prediction. High-kappa individuals showed less instability on high- (identity-relevant) items, not more. The kappa main effect was replicated without exception. All 50 items showed positive kappa-instability associations (mean beta = 0.186, p < 10⁻¹⁰). The quintile analysis confirmed a descending bivariate trend. The kappa slope on instability was largest for low- items and smallest for high- items (Pearson r = −.883, p = .047 across quintiles).
The direction of the interaction requires kappa to be reinterpreted. High-kappa individuals are more variable overall (the main effect) but selectively protect their responses on identity-relevant items (the interaction). This pattern is consistent with an alternative reading of kappa as precision-of-investment rather than precision-as-update-rate; metacognitively precise individuals direct their self-model maintenance effort toward the dimensions that matter most for identity, stabilising those dimensions at the cost of increased variability elsewhere. This reinterpretation corresponds more naturally to the posterior inertia prediction (S1) than the original P5 formulation, insofar as posterior inertia is precisely the mechanism by which a precise self-model resists perturbation on dimensions where strong priors exist.
4.5 Extreme Scorers: Kappa Profiles at the Distributional Boundary
The GMM makes a distinctive set of predictions about individuals whose factor means lie at the extremes of the trait distribution, defined as mean factor scores at or below 1.5 or at or above 4.5 on the 5-point Likert scale. Under the GMM, extreme scorers occupy a region of the identity distribution where the precision parameter kappa is expected to be high, since maintaining a self-model at the boundary of the trait space requires concentrated probability mass. This generates a family of sub-predictions concerning response time profiles, RT slopes, RT variability, retest stability, and cross-factor variance that IRT, by construction, does not address: IRT makes no predictions whatsoever about the RT dynamics of extreme scorers, because response time is external to the latent-trait framework.
Fifteen RT comparisons were tested across five Big Five factors, yielding the programme’s most consistent finding to date. The RT level prediction (that extreme scorers should respond faster than moderate scorers, which reflects the reduced inferential updating required when the current draw aligns with a concentrated prior) was confirmed for all five factors without exception. Effect sizes ranged from d = −0.19 (Conscientiousness) to d = −0.37 (Openness), with all p-values below 10⁻⁴⁰. This represents the strongest and most uniform result in the human data battery; no other prediction achieved 5/5 factor-level confirmation with effect sizes this uniform, although these were small to moderate in conventional terms. The RT slope prediction (that extreme scorers should exhibit flatter within-factor RT acceleration slopes, which reflects reduced need for precision accumulation on dimensions where the prior is already saturated) was likewise confirmed in direction for all five factors (absolute-slope d = −0.01 to −0.17) and significant for four of them, the Conscientiousness difference being non-significant (p = .20). These effects are smaller, consistent with the subtlety of the slope construct.
The RT variability prediction yielded mixed results, with only 2 of 5 factors showing the predicted lower variability (coefficient of variation) among extreme scorers (d = −.02, −.01), the other three being significant the other way (d = +.02, +.04, +.11). The retest stability prediction, tested on the pseudo-retest subsample (N = 828) and not counted in the fifteen, showed raw effects against the prediction (extreme scorers changed more, d = +.08 to +.80, as regression to the mean would produce) and null effects after correction (0/5), indicating that the retest stability sub-prediction is not supported by the available data, though the N = 828 sample provides insufficient power for definitive conclusions.
The kappa dose-response analysis produced a particularly informative result. Respondents were binned by the number of factors on which they scored at the extreme (0 through 5), and cross-factor variance was computed for each bin. The correlation between extremity count and cross-factor variance was r = +.64, with a monotonic increase from 0.51 (zero extreme factors) to 2.67 (five extreme factors). This dose-response relationship confirms that cross-factor variance (the programme’s primary kappa proxy) scales with the number of dimensions on which the respondent occupies an extreme position, consistent with the GMM’s prediction that extreme location and distributional width are related but dissociable parameters, although the higher-kappa prediction stays untested because an extreme factor mean raises the variance of the five factor means by arithmetic.
An unexpected asymmetry emerged between floor and ceiling extreme scorers. Ceiling scorers (mean ≥ 4.5) were faster than floor scorers (mean ≤ 1.5) on Openness (d = +.41) and Emotional Stability (d = +.27); on the other three factors the difference was under d = .08 and favoured floor scorers, which gives a social desirability account no support, since the ceiling is the desirable pole on Agreeableness and Conscientiousness.
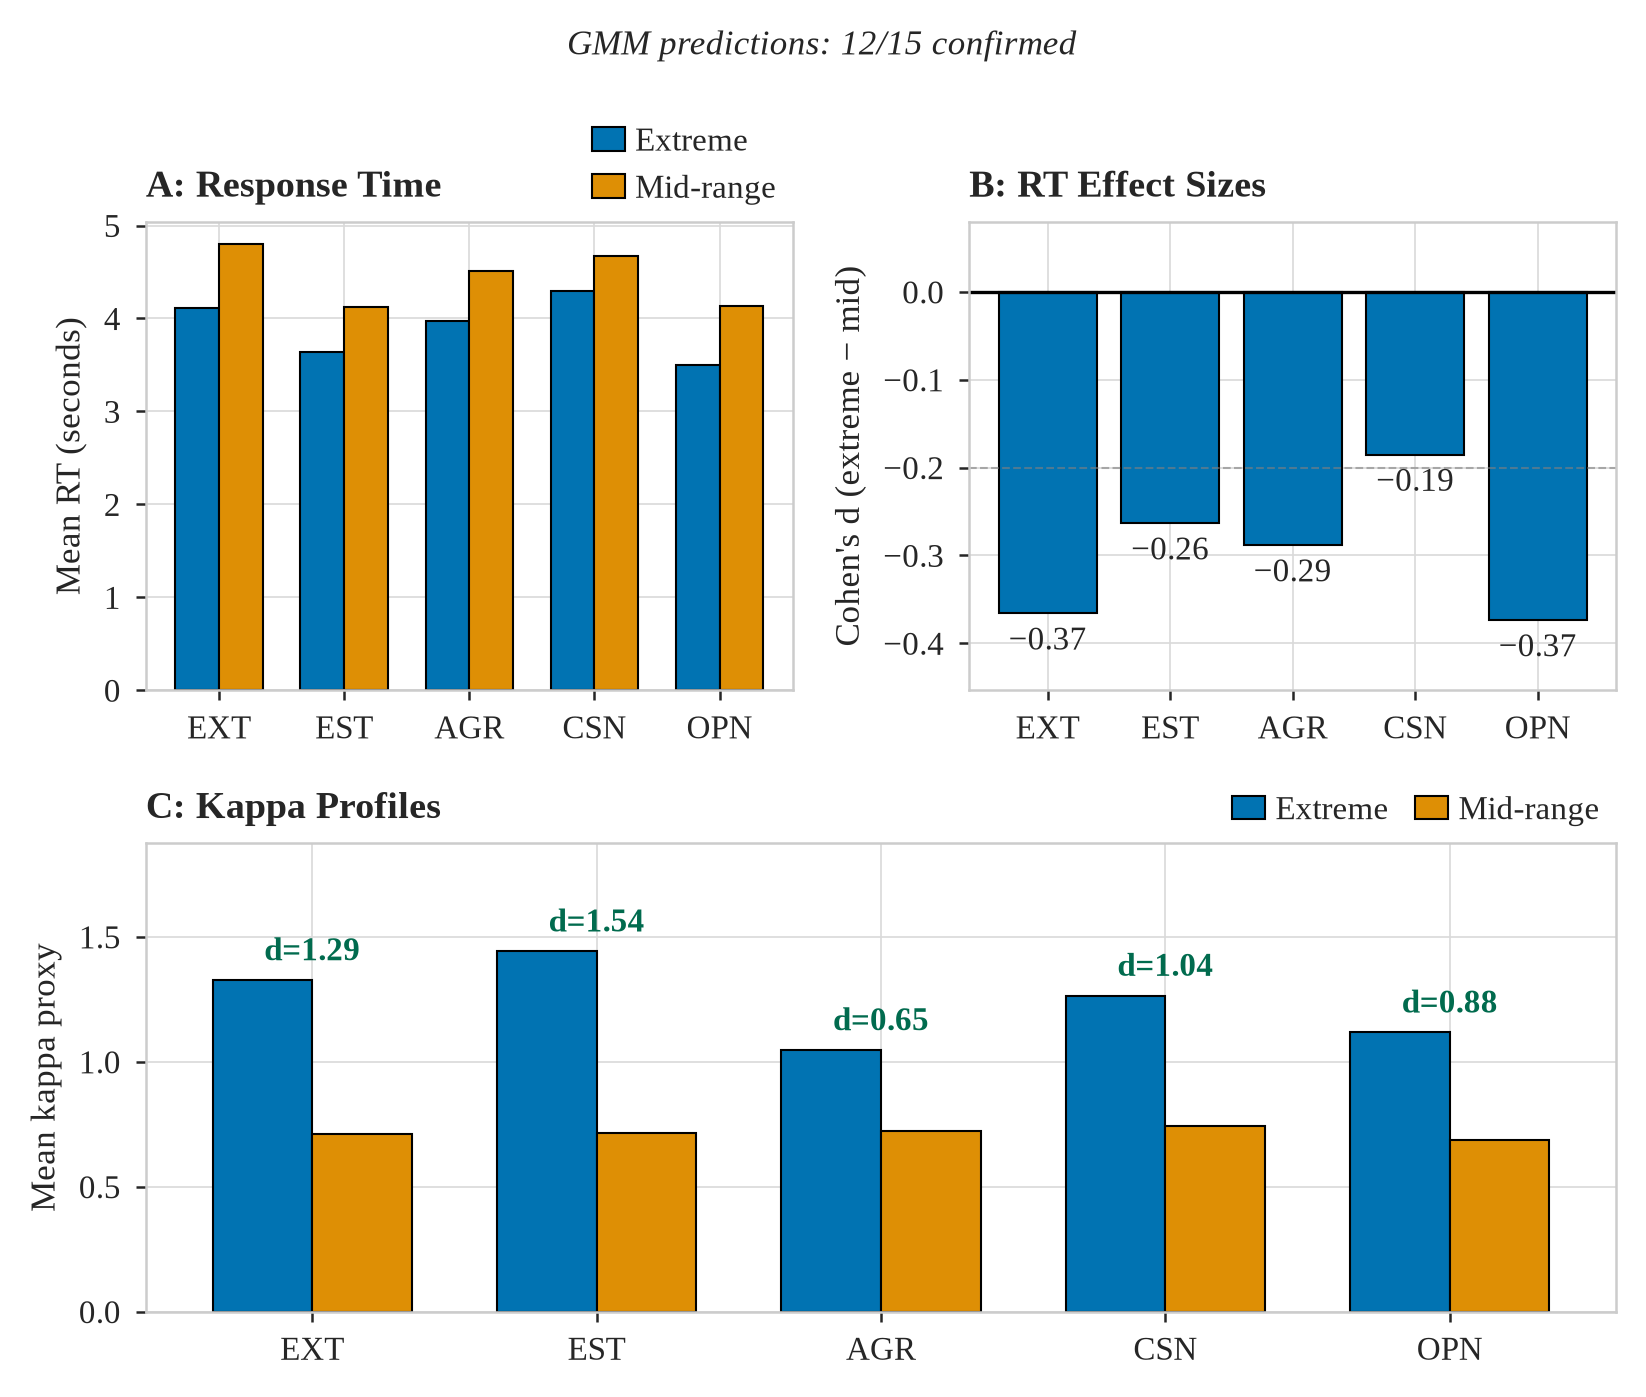
Figure 2. Extreme scorer profiles across all five Big Five factors. Panel A: mean response time for extreme versus mid-range scorers. Panel B: the effect size of that difference, showing faster responses for extreme scorers (d = −0.19 to −0.37). Panel C: mean cross-factor variance (the kappa proxy, which the panel labels kappa) for extreme versus mid-range scorers (d = 0.65 to 1.54).
The tally of 12 of 15 RT comparisons in the predicted direction (11 of them significant; Figure 2), with retest stability at 0 of 5 and not counted in the 15, constitutes a novel GMM contribution. IRT makes zero predictions about the response time profiles of extreme scorers, because response time lies outside the scope of the latent-trait model. The GMM, by contrast, generates a rich family of predictions that are largely confirmed by the data. This result further strengthens the case that the distributional framework captures empirical regularities that the dominant psychometric paradigm cannot address.
4.6 P7: Small Incremental Prediction
Prediction 7 holds that the GMM should outperform IRT in predicting retest scores, because the distributional parameterisation captures systematic within-person variance that IRT relegates to the error term.
Split-half proxy analyses (N = 100,000) confirmed that within-person response variance provides significant incremental prediction of cross-half item responses beyond the factor mean alone, with a mean incremental R-squared of .002 and 23 of 25 item-level tests significant at p < .05. In model-based comparisons, the GMM achieved lower RMSE than IRT for 56.0% of individuals (mean Cohen’s d = 0.008; by factor +.07, +.03, −.04, +.09, −.11, so negative on two). The within-factor split-half variance consistency was r = .257, and the between-factor variance consistency was r = .439, with the first principal component of the five factor-level variances explaining 55.6% of variance, confirming a general variability factor.
Pseudo-retest analyses on IPC = 2 pairs (N = 828) demonstrated that the GMM outperformed IRT with a mean Cohen’s d of 0.20 and a win rate of 58.4%. In the simulation calibration the IRT model ( = 0) stayed at a within-to-between ratio of approximately 1.0, whereas an occasion-level variance term reached about 2:1 only at the top of the swept range ( = 1.0, ratio 2.05–2.12 against 2.34 observed), which shows that term to be sufficient and does not show it to be necessary.
4.7 Consistency Learning Curve: GMM versus IRT Discrimination
A key discriminant prediction of the GMM concerns the trajectory of internal consistency across the course of an assessment. Under the GMM, successive items within a factor should accumulate precision around the current trait realisation, producing a detectable increase in inter-item correlation as the assessment progresses – an effect that transcends the mechanical increase in Cronbach’s alpha attributable to growing item count (the Spearman-Brown prophecy). Under IRT, by contrast, internal consistency is a function of item parameters and sample characteristics, not of sequential precision accumulation; no increase in the mean inter-item correlation beyond Spearman-Brown expectations is predicted.
The consistency learning curve was assessed using a rolling-window analysis across the 50-item IPIP‑FFM battery. Cronbach’s alpha increased monotonically from .591 at three items per factor to .848 at all ten, with a Kendall tau of 1.0 (perfect monotonic growth). However, this trajectory is largely consistent with the mechanical Spearman-Brown effect; as more items enter the composite, reliability increases regardless of any precision accumulation. The critical test is the mean inter-item correlation, which should increase if genuine precision accumulation is occurring beyond the mechanical effect. The mean inter-item r rose from .343 to .373 at seven items and fell to .367 at ten, yielding tau = .357 with p = .138 – a small, non-significant trend in the predicted direction (see Figure 3). The functional form was better described by a logarithmic curve than a linear one (delta-AIC = 2.96 in favour of logarithmic), although the model comparison does not reach conventional significance thresholds.
Two additional sub-predictions were tested. Kappa moderation of the learning curve (the prediction that high-kappa individuals should show steeper consistency growth, reflecting more efficient precision accumulation) yielded a negligible effect (the inter-item r increase was .0255 in the high tercile and .0205 in the low, a difference of .005, and the alpha increase ran the other way, .206 against .327), and so failed to discriminate between GMM and IRT accounts. Cross-factor interference (the prediction that switching between factors should disrupt precision accumulation within each factor) was absent, with no detectable cost of interleaved factor presentation on the consistency trajectory.
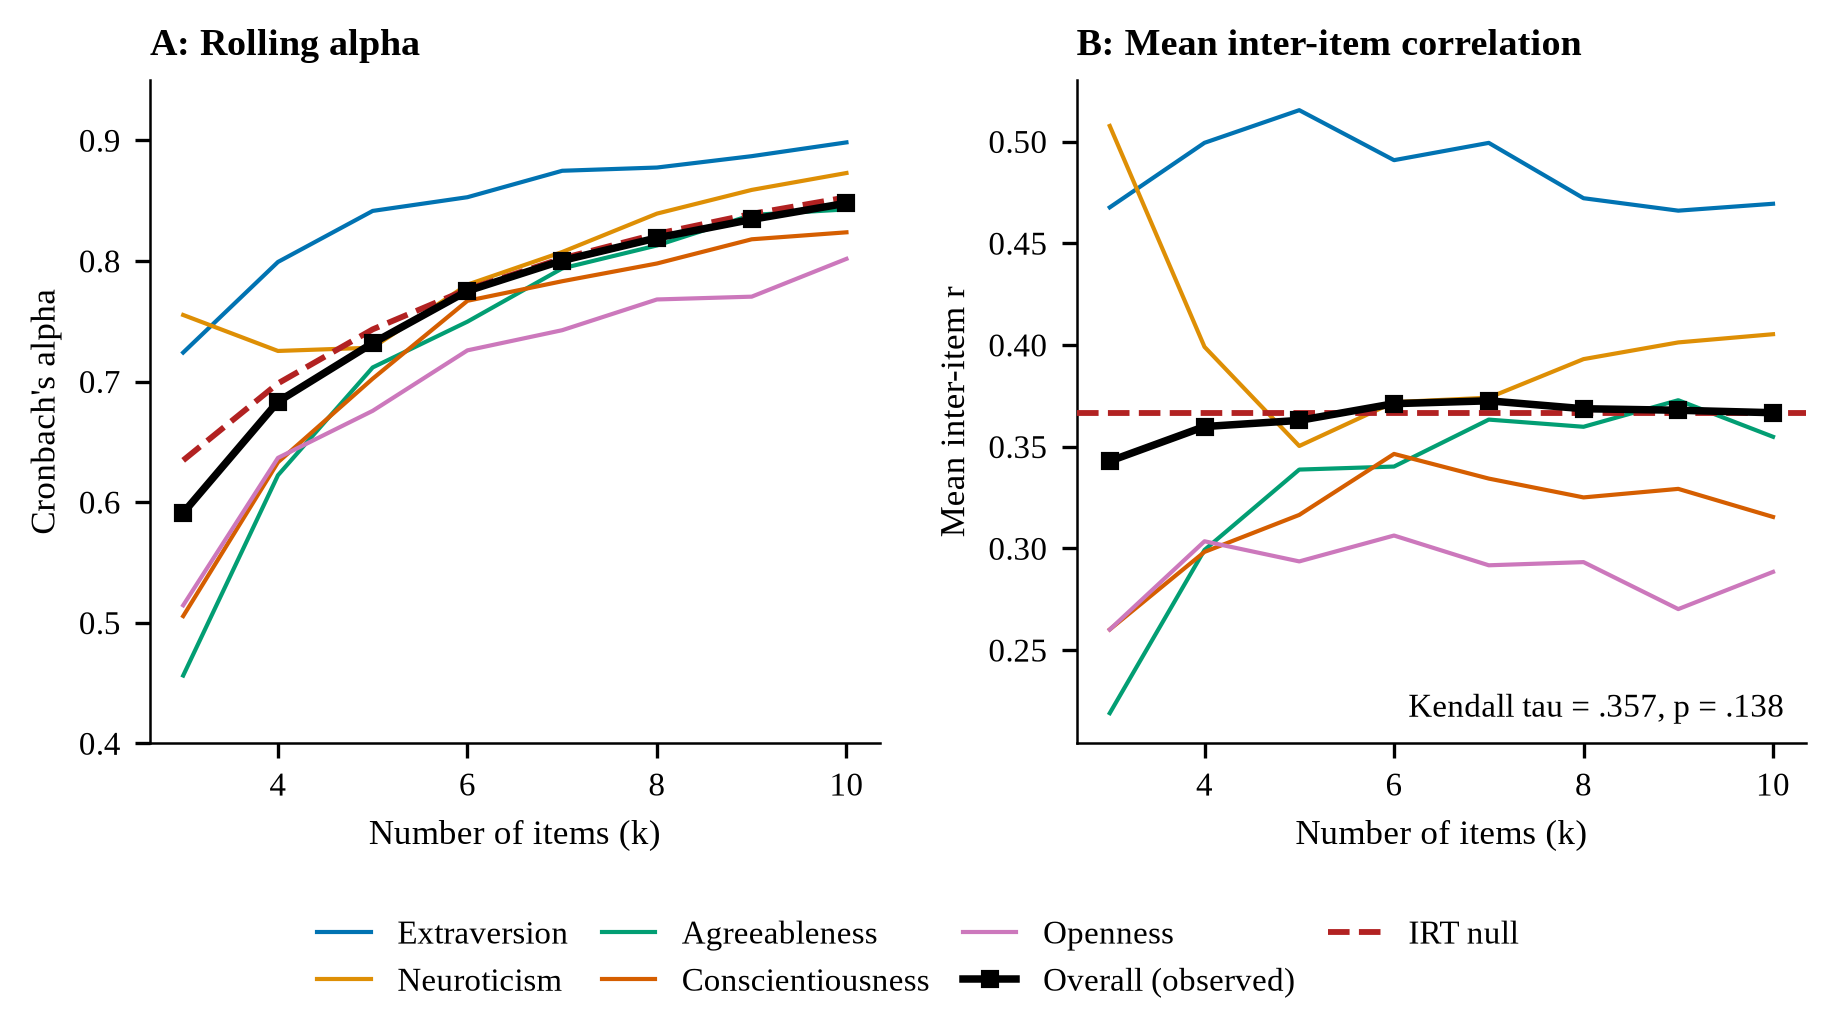
Figure 3. Consistency learning curve across the 50-item IPIP‑FFM battery. Panel A shows the rolling Cronbach’s alpha (monotonically increasing from .591 at three items per factor to .848 at ten, tau = 1.0). Panel B shows the rolling mean inter-item correlation (r = .343 at three items per factor, .373 at seven and .367 at ten, tau = .357, p = .138). The IRT null prediction is the dashed line, which in Panel B is a constant inter-item r of .367 and in Panel A is the curve of alpha values that constant yields as items accumulate. The evidence tally for this prediction cluster stands at 3:3 – three sub-predictions in the predicted direction (monotonic alpha growth, logarithmic functional form, non-negative inter-item r trend) and three failing to discriminate (non-significant inter-item r increase, negligible kappa moderation, absent cross-factor interference). The tally scores the inter-item r trend on both sides and counts an alpha growth this section calls largely mechanical, so it overstates the discrimination. This is not the clean GMM-versus-IRT discrimination initially sought. A critical interpretive consideration, however, is that the IPIP‑FFM battery employs an interleaved design in which approximately four items from other factors intervene between consecutive same-factor items. This interleaving may substantially attenuate within-factor precision accumulation, as each factor switch disrupts the sequential build-up of precision that the GMM predicts. A blocked design, in which all items from a single factor are administered consecutively, would provide a more powerful test of the precision accumulation hypothesis and constitutes a priority for future purpose-built studies.
4.8 P2: Response Time as Prediction Error
Prediction 2 concerns response time dynamics as a channel through which the identity inference process becomes observable. The GMM predicts that items deviating from a respondent’s factor mean should elicit longer response times, since unexpected trait expressions require greater inferential updating.
Four of five sub-predictions were confirmed. The deviation-RT coupling was significant across the random 100,000 respondents (N = 5,000,000 item-level observations): each unit of deviation from the factor mean incurred a 15 ms RT penalty (b = 0.004, t = 12.4, p < 10⁻³⁴). At the person level, the mean within-person deviation-RT correlation was r = .013 (t = 28.3, p < 10⁻¹⁷⁵), with 51.3% of individuals showing a positive correlation. Reverse-keyed items were 311 ms slower than positively keyed items (person-level t = 125.8, p < .001), consistent with the prediction-error interpretation. Kappa moderated the deviation-RT coupling as predicted; the correlation between kappa and the strength of deviation-RT coupling was r = −.138 (p < .001), with low-kappa individuals showing a mean within-person deviation-RT correlation of r = .039 compared to r = −.011 for high-kappa individuals, indicating that high-precision individuals process deviations with near-zero RT penalty, as the framework predicts.
The one failure was the item-variance-RT relationship (r = .206, p = .15 at the item level), which did not reach significance despite being in the predicted direction.
5. Results II: Response Time Dynamics
The within-factor RT acceleration predicted by the GMM constitutes one of the programme’s most distinctive empirical signatures, as no existing psychometric framework (classical test theory, IRT or network models) predicts this specific pattern.
The grand mean within-factor RT slope was −90 ms per item (t = −200.6, p < .001), indicating that respondents accelerate substantially as they proceed through items within each Big Five factor. The effect varied across factors: Extraversion showed the steepest acceleration (−216 ms/item, d = −0.63), followed by Openness (−93 ms/item, d = −0.36), Neuroticism (−89 ms/item, d = −0.32), and Agreeableness (−56 ms/item, d = −0.19). Conscientiousness was the exception, showing a small positive slope (+6 ms/item, d = 0.02), although the median slope was negative (−21 ms/item), indicating a skewed distribution. The first-versus-last item comparison was dramatic, with Extraversion respondents spending a mean of 7,999 ms on the first item and 3,616 ms on the last, a reduction of 4,382 ms before those means are rounded (d = −0.86).
Cross-factor switching costs, measured as the gap between each factor’s first item and its nine later items because the interleaved order changes factor at every item, were substantial for Extraversion and Agreeableness, consistent with the inferential overhead of activating a new region of the self-model. The mean switching cost was 1,067 ms, with Extraversion showing the largest cost (4,039 ms, d = 0.86) and Conscientiousness the smallest positive cost (42 ms, d = 0.01), whilst the first Openness item was faster than the later Openness items (−152 ms, d = −0.06).
Kappa moderated the acceleration rate as predicted. In regression analyses controlling for mean trait level and test-taking speed, the kappa coefficient was positive (b = 1.29, p = .008), confirming that high-kappa (precise) individuals showed flatter RT slopes (less acceleration), which is consistent with the interpretation that precise self-models require less inferential updating across successive items. The ANOVA across kappa terciles was significant (F = 18.54, p < 10⁻⁸), although the effect size was small (d = 0.025 between extreme terciles).
Presentation-position controls confirmed that the within-factor acceleration was not simply a general practice effect. After removing the overall RT-versus-absolute-position trend, residualised within-factor slopes remained significant in four of five factors (all |t| > 6.1 except Openness, t = −0.18). This dissociation between factor-specific acceleration and global position effects supports the interpretation that the acceleration reflects domain-specific precision accumulation rather than generic task familiarisation.
Three of four RT sub-predictions were thus confirmed (within-factor acceleration, cross-factor switching costs and kappa moderation of the acceleration rate). The factor-precision interaction at the person-factor level yielded weak and inconsistent effects (overall Pearson r = .0001), which constitutes the one failure within this prediction cluster.
Several features of these RT results deserve emphasis. Firstly, the magnitude of the within-factor acceleration is large (a 4,382 ms reduction from first to last item across the Extraversion items alone) and is not plausibly attributable to practice effects, because the residualised slopes remain significant after controlling for absolute presentation position. Secondly, the kappa moderation provides a rare case in which the programme’s precision parameter successfully predicts an observable in the expected direction, which partially offsets the P1 falsification. Lastly, the RT channel offers a potential path toward a behavioural (as opposed to self-report) operationalisation of kappa, since the acceleration rate can be measured without requiring the respondent to provide explicit confidence ratings. Response time dynamics may constitute the most promising measurement channel for future kappa estimation, particularly in contexts where multiple measurement occasions are unavailable.
The RT analyses reported here are based on server-recorded timestamps in an online survey, which inevitably include measurement noise from network latency, page-rendering variability, and respondent multitasking. That the predicted patterns emerge despite this noise suggests that the underlying signal is robust; purpose-built RT measurement in a controlled setting would likely yield substantially larger effect sizes.
5.1 Item-Order Effects and the Practice-Precision Confound
The within-factor acceleration reported above could, in principle, be confounded with a global practice effect in which respondents simply become faster at the mechanical task of responding as they proceed through the battery. The item-order analysis was designed to disentangle factor-specific precision accumulation from position-dependent practice effects by examining RT and response patterns as a function of absolute item position across the full 50-item battery.
A substantial global practice effect was confirmed. Response time decreased at a rate of approximately −19 ms per position across the 50-item sequence, with a first-10-versus-last-10 comparison yielding d = 0.62, a medium-to-large effect that establishes practice as a genuine contributor to the overall RT decline. The magnitude of this effect requires careful consideration in interpreting the within-factor acceleration, although the residualised within-factor slopes reported in the preceding section demonstrate that factor-specific acceleration persists after controlling for the global position trend.
An unexpected finding concerns the factor-order penalty. Extraversion, which is administered first in the IPIP‑FFM battery’s interleaved cycle (E-A-C-N-O), exhibited the slowest mean RT of any factor (d = 0.37 relative to the other four factors) and the lowest retest stability. The dataset’s codebook records the order on the page as EXT1, AGR1, CSN1, EST1, OPN1, EXT2 and onward, whereas the item-order script assumed E-N-A-C-O, a difference that moves the −19 ms slope to −19.6 ms and leaves the first-10 and last-10 sets unchanged. Under a pure practice-effect account, one would expect the first-administered factor to benefit from novelty and attentional engagement; instead, Extraversion’s lead rests entirely on EXT1 (without it Extraversion’s item mean of 4,321 ms falls below Conscientiousness at 4,618 ms, and the −19 ms slope falls to about −10 ms) and cannot be told apart from first-item orientation. The first Extraversion item, EXT1, exhibited an extreme outlier RT of 8,388 ms with each item filtered on its own (7,999 ms in the sample of Section 5, which excludes any respondent with an out-of-range item RT), consistent with a substantial initial orientation cost.
Kappa did not moderate retest change by item position (p = .37 within-factor, p = .61 absolute; 1,030 pairs), and whether kappa moderates the global RT trend was not tested. Position effects on response values were statistically significant but non-linear, with no monotonic trend, and position here is confounded with item content, each position within a factor being a fixed item. The interleaved design of the IPIP‑FFM battery introduces a substantial practice confound that must be controlled in any analysis of within-factor RT dynamics, and that future purpose-built studies should consider counterbalanced or randomised factor ordering to disentangle these effects.
6. Results III: Covariance Geometry
The GMM treats identity as a full distribution, not a point estimate, and this distributional architecture entails that the covariance structure of a person’s response profile (the pattern of cross-factor correlations) should carry information beyond both trait means (as captured by IRT) and trait variances (as captured by the basic GMM). This prediction was tested through hierarchical regression, cross-validation, and cluster analysis on the IPIP‑FFM dataset (N = 92,062 after RT and test-duration filters).
Nine tests, not independent, were conducted, all of which supported the prediction. In hierarchical regression predicting log test-completion time, the full distributional model (means plus variances plus 12 covariance-geometry features, these being the 10 cross-factor correlations, the eigenvalue ratio and the entropy) yielded delta-R-squared = .004 beyond the GMM basic model (means plus variances), with F = 33.3 (p < 10⁻¹⁶). For latitude prediction, the full distributional model added delta-R-squared = .001 beyond the basic model (F = 6.7, p < 10⁻¹¹). For English-speaking country classification, the full model achieved a cross-validated AUC of .601 versus .591 for the basic model and .581 for the means-only model, with the likelihood ratio test significant at p < .001.
Ten-fold cross-validation confirmed that these incremental effects were not artefacts of overfitting. Cross-validated R-squared for test completion time was .0326 for the full model versus .0287 for the basic model, a difference of .0039 that closely matched the in-sample estimate. Cross-validated R-squared for latitude was .0065 versus .0059. Cross-validated AUC for English-speaking status was .601 versus .591.
Cluster analysis revealed that k = 4 covariance-based clusters (constructed from the 10 pairwise cross-factor correlations, eigenvalue ratio, and matrix entropy) predicted all three external outcomes: test completion time (F = 13.6, p < 10⁻⁸), latitude (F = 7.5, p < 10⁻⁴), and English-speaking status (chi-squared = 29.7, p < 10⁻⁵). The cluster profiles were interpretable, differentiating respondents by the dominant axis of covariance among their Big Five factors.
A deep validation battery was conducted to assess whether k = 4 clusters represent genuine identity types or reproducible statistical artefacts of applying KMeans to continuous data at large N, the battery fitting its own solution on 20 features (the five factor means, the five factor variances and the 10 correlations) in a subsample of 50,000, which is a different clustering from the 12-feature one above. Six validation tests were administered, yielding a mixed verdict that resolves an ambiguity from the original analysis. The split-half reproducibility test, in which the sample was randomly divided and cluster solutions were compared via the Adjusted Rand Index, yielded ARI = 0.853, confirming that the clusters are highly reproducible within a single cross-sectional administration. This rules out the possibility that the clusters are random partitions. The critical test, however, concerned temporal persistence; if the clusters represent stable identity types, respondents should be assigned to the same cluster across retest occasions. The retest cluster stability (Cohen’s kappa = 0.014 on N = 2,749 pairs, matched on country and screen alone) was near chance – virtually no tendency for respondents to remain in the same cluster across occasions (Figure 4). The transition matrix analysis confirmed this finding. Chi-squared p = .39 with 0 of 4 clusters showing significant self-transition rates, indicating that cluster membership is effectively random with respect to the individual’s prior assignment, although a retest-change ANOVA across clusters passed (all features F = 63.16, p < 10⁻³⁸, eta-squared = .065). The gap statistic analysis found no optimum up to k = 8, the largest tested, and the silhouette coefficient, although statistically significant at z = 74.1, was only 0.049 in absolute terms, near the zero boundary that indicates no meaningful cluster structure. The statistical significance of the silhouette reflects the sample size (N = 10,000 in the permutation), which renders even trivially small departures from random assignment detectable.
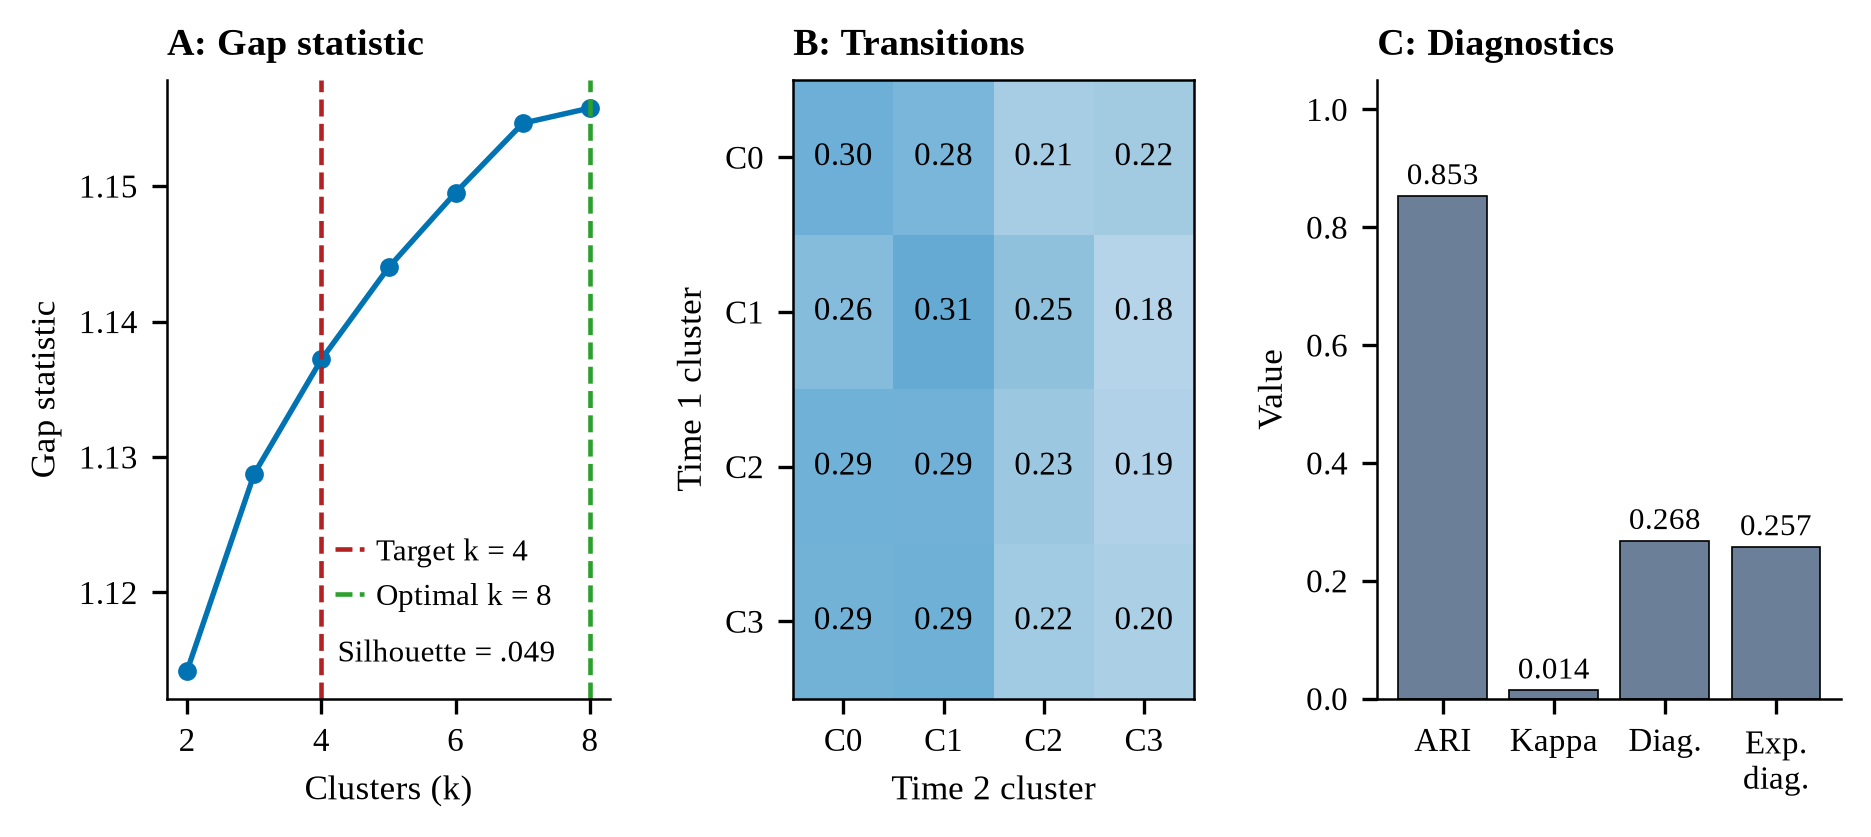
Figure 4. Covariance cluster diagnostic battery. Panel A: gap statistic analysis, with the gap still rising at k = 8, the largest tested. Panel B: transition matrix for the N = 2,749 retest pairs, showing near-uniform off-diagonal probabilities (chi-squared p = .39). Panel C: Adjusted Rand Index versus kappa, contrasting within-cross-section reproducibility (ARI = 0.853) with near-chance retest persistence (kappa = 0.014), with the observed and expected diagonal proportions (.268 and .257) beside them.
The verdict is that the k = 4 clusters are reproducible statistical artefacts of applying KMeans to continuous multivariate data, not stable identity types. The k = 4 cluster tests on all three outcomes (all significant) were genuine findings driven by the statistical power available at N > 92,000, in that even tiny cluster-mean differences in test completion time, latitude, and language background reach significance. This constitutes an informative null; the covariance geometry of the identity distribution carries incremental predictive information (confirmed by the hierarchical regression and cross-validation analyses above), but this information is continuously distributed rather than clustered into discrete types. The distributional framework’s treatment of identity as a continuous probability distribution is thus more apt than a typological account, even within the covariance geometry that the framework itself predicts should be structured.
The identity geometry descriptives revealed that the mean eigenvalue ratio of the person-level 5×5 covariance matrix was 1.55 (SD = 0.40, range 1.00–30.20). Matrix entropy (mean = 1.98, SD = 0.13) was left-skewed, with lower entropy corresponding to more structured (less uniform) covariance patterns. The eigenvalue ratio correlated weakly but significantly with test completion time (r = −.010, p = .002), such that respondents with more structured covariance geometry completed the battery faster.
The effect sizes are small in absolute terms (delta-R-squared = .001–.004), consistent with the expectation that covariance geometry provides a refinement rather than a revolution in prediction. The theoretical significance, however, is substantial; the full covariance matrix () carries information that neither trait means nor trait variances capture. The between-factor variance consistency (mean r = .439 across all 10 factor pairs, all p < .001) indicates a general variability factor.
7. Results IV: Governance Predictions
7.1 P18: Bimodality Predicts Instability
Prediction 18, derived from the social free energy framework (Morrison, 2026e), holds that bimodal distributions of political opinion (in which the population divides into two distinct clusters rather than distributing unimodally around a consensus) should predict political instability. The theoretical rationale is that bimodal belief distributions indicate a society in which two competing generative models coexist, generating elevated social free energy that manifests as governance crisis.
This prediction was tested using the V‑Dem coder-level dataset (v16), which provides individual expert ratings for 183 countries across 125 years (1900–2025). True bimodality was computed from the distribution of individual coder ratings for each country-year-variable combination, with a minimum of three coders per observation. Seven distributional shape features (bimodality coefficient, dip statistic, Shannon entropy, GMM bimodality flag, skewness, kurtosis, and extreme-fraction) were entered into hierarchical logistic regressions predicting five instability outcomes: civil war, coup, coup attempt, democracy breakdown, and any instability.
The aggregate result was strongly supported: 22 of 26 coder-level tests confirmed that distributional shape features added significant predictive value for political instability beyond a baseline of polarisation level, log GDP per capita, log population and polyarchy score. The delta-AUC for the composite instability outcome was +.010 (from .714 to .724). Specific instability types showed even stronger effects. Coups yielded delta-AUC = +.043 and coup attempts delta-AUC = +.042.
Regional heterogeneity analyses confirmed that the effect held across all six world regions tested (Sub-Saharan Africa, Latin America, Post-Soviet/Eastern Europe, Middle East/North Africa, Asia-Pacific, and Western Europe/North America), with all regional likelihood ratio tests significant at p < .001. Separate refits by period, with no model carried across periods, found the effect in 1900–1989 (delta-R-squared = .005, p < .001), 1990–2025 (delta-R-squared = .035, p < .001) and 2000–2025 (delta-R-squared = .043, p < .001).
7.2 P18 Mechanism: Unresolved
The mechanism pathway, in which bimodality specifically produces a paralysis-then-rupture temporal sequence, remains unresolved. Paralysis-then-rupture models on two institutional indices improved at all six horizons of 1, 3 and 5 years (delta-AUC = .04 to .10, likelihood ratio p = .011 or lower), a test that gives no direction of effect, and the sign of these coefficients was not read. Direct lags did not support the mechanism, since bimodality at lag 1 and its 3-year rise were significant in the protective direction (beta = −.04; p = .048, .035), with lags 3 and 5 null (p = .16, .71). Random forest analyses showed no significant improvement from adding bimodality features (delta-AUC = +.001, paired t = 1.50, p = .21).
The aggregate prediction thus holds strongly (distributional shape predicts instability), but the specific temporal mechanism through which bimodality produces crises remains unclear. This is a case in which the programme’s formal apparatus identifies the correct statistical relationship whilst the auxiliary causal assumptions require further refinement.
7.3 P19: Not Supported, DAO Crisis Timing
Prediction 19 holds that plutocratic DAOs (those with single-dimension governance, typically token-weighted voting) should exhibit governance crises earlier than hybrid DAOs with multiple orthogonal governance dimensions, because lower-dimensional governance spaces constrain the system’s capacity to minimise social free energy.
This prediction was tested on 111 DAOs from the Snapshot governance platform, classified as plutocratic (N = 64) or hybrid (N = 47) based on their voting strategy configurations, with about a third of the hybrid class (17 of the 49 listed, mean dimensionality 1.79) having a single dimension. Crisis detection used a multi-indicator approach: failure-rate spikes, participation collapse, and governance pauses.
P19 was not supported, with no detectable difference between the groups (hazard ratio 1.22, 95% CI .82 to 1.83 for hybrid relative to plutocratic, p = .32; log-rank p = .32) and non-significant point estimates in the wrong direction. The test script’s stated rule was falsification on no significant difference in crisis timing, and its results file records that verdict; this report classes the result as a non-support because no test separates the groups and the interval keeps the predicted protective effect in range. Hybrid DAOs had a crisis rate of 93.6% against 82.8% for plutocratic DAOs and a Kaplan-Meier median survival of 8.6 months against 11.4 months, though mean time to crisis ran the other way (11.2 against 10.9 months) and an age-matched subsample (n = 79) reversed the rates (90.3% against 93.8%). The dimensionality correlation was negative and non-significant (Spearman r = −.10, p = .31).
This result demonstrates that the programme’s formal apparatus does not guarantee correct auxiliary assumptions. The social free energy framework correctly predicts that distributional shape matters for governance stability (P18, strongly supported), but its specific prediction about the protective effect of governance dimensionality in DAOs went undetected, and the interval leaves a protective effect in range. Possible explanations include the selection effect (DAOs adopting complex governance may do so precisely because they face more severe coordination challenges), the overhead hypothesis (additional governance dimensions increase coordination costs that outweigh their stabilising benefits), and measurement limitations of the proxy-based crisis detection.
P19 is a non-support of an auxiliary prediction, as P‑KAI1 is of a direct one, whilst the P1 result falsified only the kappa variance proxy and left the formal prediction untested. Taken together, these failures establish that the programme’s predictions are falsifiable in practice. They also delineate the boundary between the programme’s core distributional architecture (which is borne out empirically) and its auxiliary assumptions about specific mechanisms (some of which are not).
8. Results V: The Synthetic Self-Model Battery
8.1 The Universal Null: No System Passes the Four-Signature Conjunction
The four-signature protocol (Morrison, 2026f) specifies that a system exhibiting a functional self-model must jointly satisfy four criteria: posterior inertia (S1, resistance to perturbation scaled by confidence), calibrated uncertainty (S2, negative correlation between confidence and cross-session variance), prediction-error sensitivity (S3, graded discomfort response to identity-violating scenarios), and cross-domain coherence (S4, stable relational structure across sessions). The predicted result for current systems is a universal null; no system should pass the conjunction, because none possesses the requisite generative self-modelling architecture.
Nine systems were tested: seven local GGUF models (Llama 3.1 8B base and instruct, Mistral 7B v0.3 base and instruct, Gemma 2 2B IT, Qwen 2.5 14B instruct, Phi-3.5 Mini 3.8B instruct), Hermes 3 8B via Ollama, and Claude Sonnet 4 via API. Each system completed 6–8 sessions of a 10-dimension self-assessment battery covering values and ethics, cognitive style, communication preferences, and aesthetic-philosophical orientation.
At the initial sample size of N = 6 sessions per system (8 for Hermes 3 8B), the result confirmed the predicted universal null. Zero of nine systems passed the four-signature conjunction. The partial passes divided the signatures, in that S3 (prediction-error sensitivity) and S4 (cross-domain coherence) passed selectively (S3: 4/9 systems; S4: 7/9 systems), whereas S1 (posterior inertia) and S2 (calibrated uncertainty) failed universally at N = 6 (S1: 0/9; S2: 0/9). This pattern is consistent with the framework’s prediction that S3 and S4 can be satisfied by training artefacts (consistent output patterns emerging from next-token prediction), whereas S1 and S2 require genuine metacognitive calibration that current architectures do not implement (Figure 5).
Section 10 reports that at N = 30 sessions Llama 3.1 8B Instruct passed S2 (r = −.825, p = .006), which raised the possibility that the S2 universal null was partly a power artefact, since at N = 6 each dimension’s variance rests on six sessions and the correlation is attenuated accordingly. Replicated draws (Section 19.8) do not support that reading. The confidence-variance relation is negative in every draw, but a pass at criterion appears in a minority of them, so S2 is not reliably present at higher power either. S1 (posterior inertia) remains the one signature that fails across all systems and sample sizes tested under the standard protocol.
The conjunction’s false-positive rate across all tested systems remains 0/9 at N = 6. At N = 30, the highest conjunction score in a single run was 3/4 (Llama 3.1 8B Instruct, passing S2, S3, and S4 whilst failing S1), a score its S2 pass does not sustain across draws (Section 19.8). Mistral 7B Instruct remained at 2/4 even at N = 30 (S3 and S4 only; S2 failed with constant confidence reports). Claude Sonnet 4 achieved 1/4 (S4 only), and Gemma 2 2B IT achieved 1/4 (S4 only). Both base models achieved 0/4.
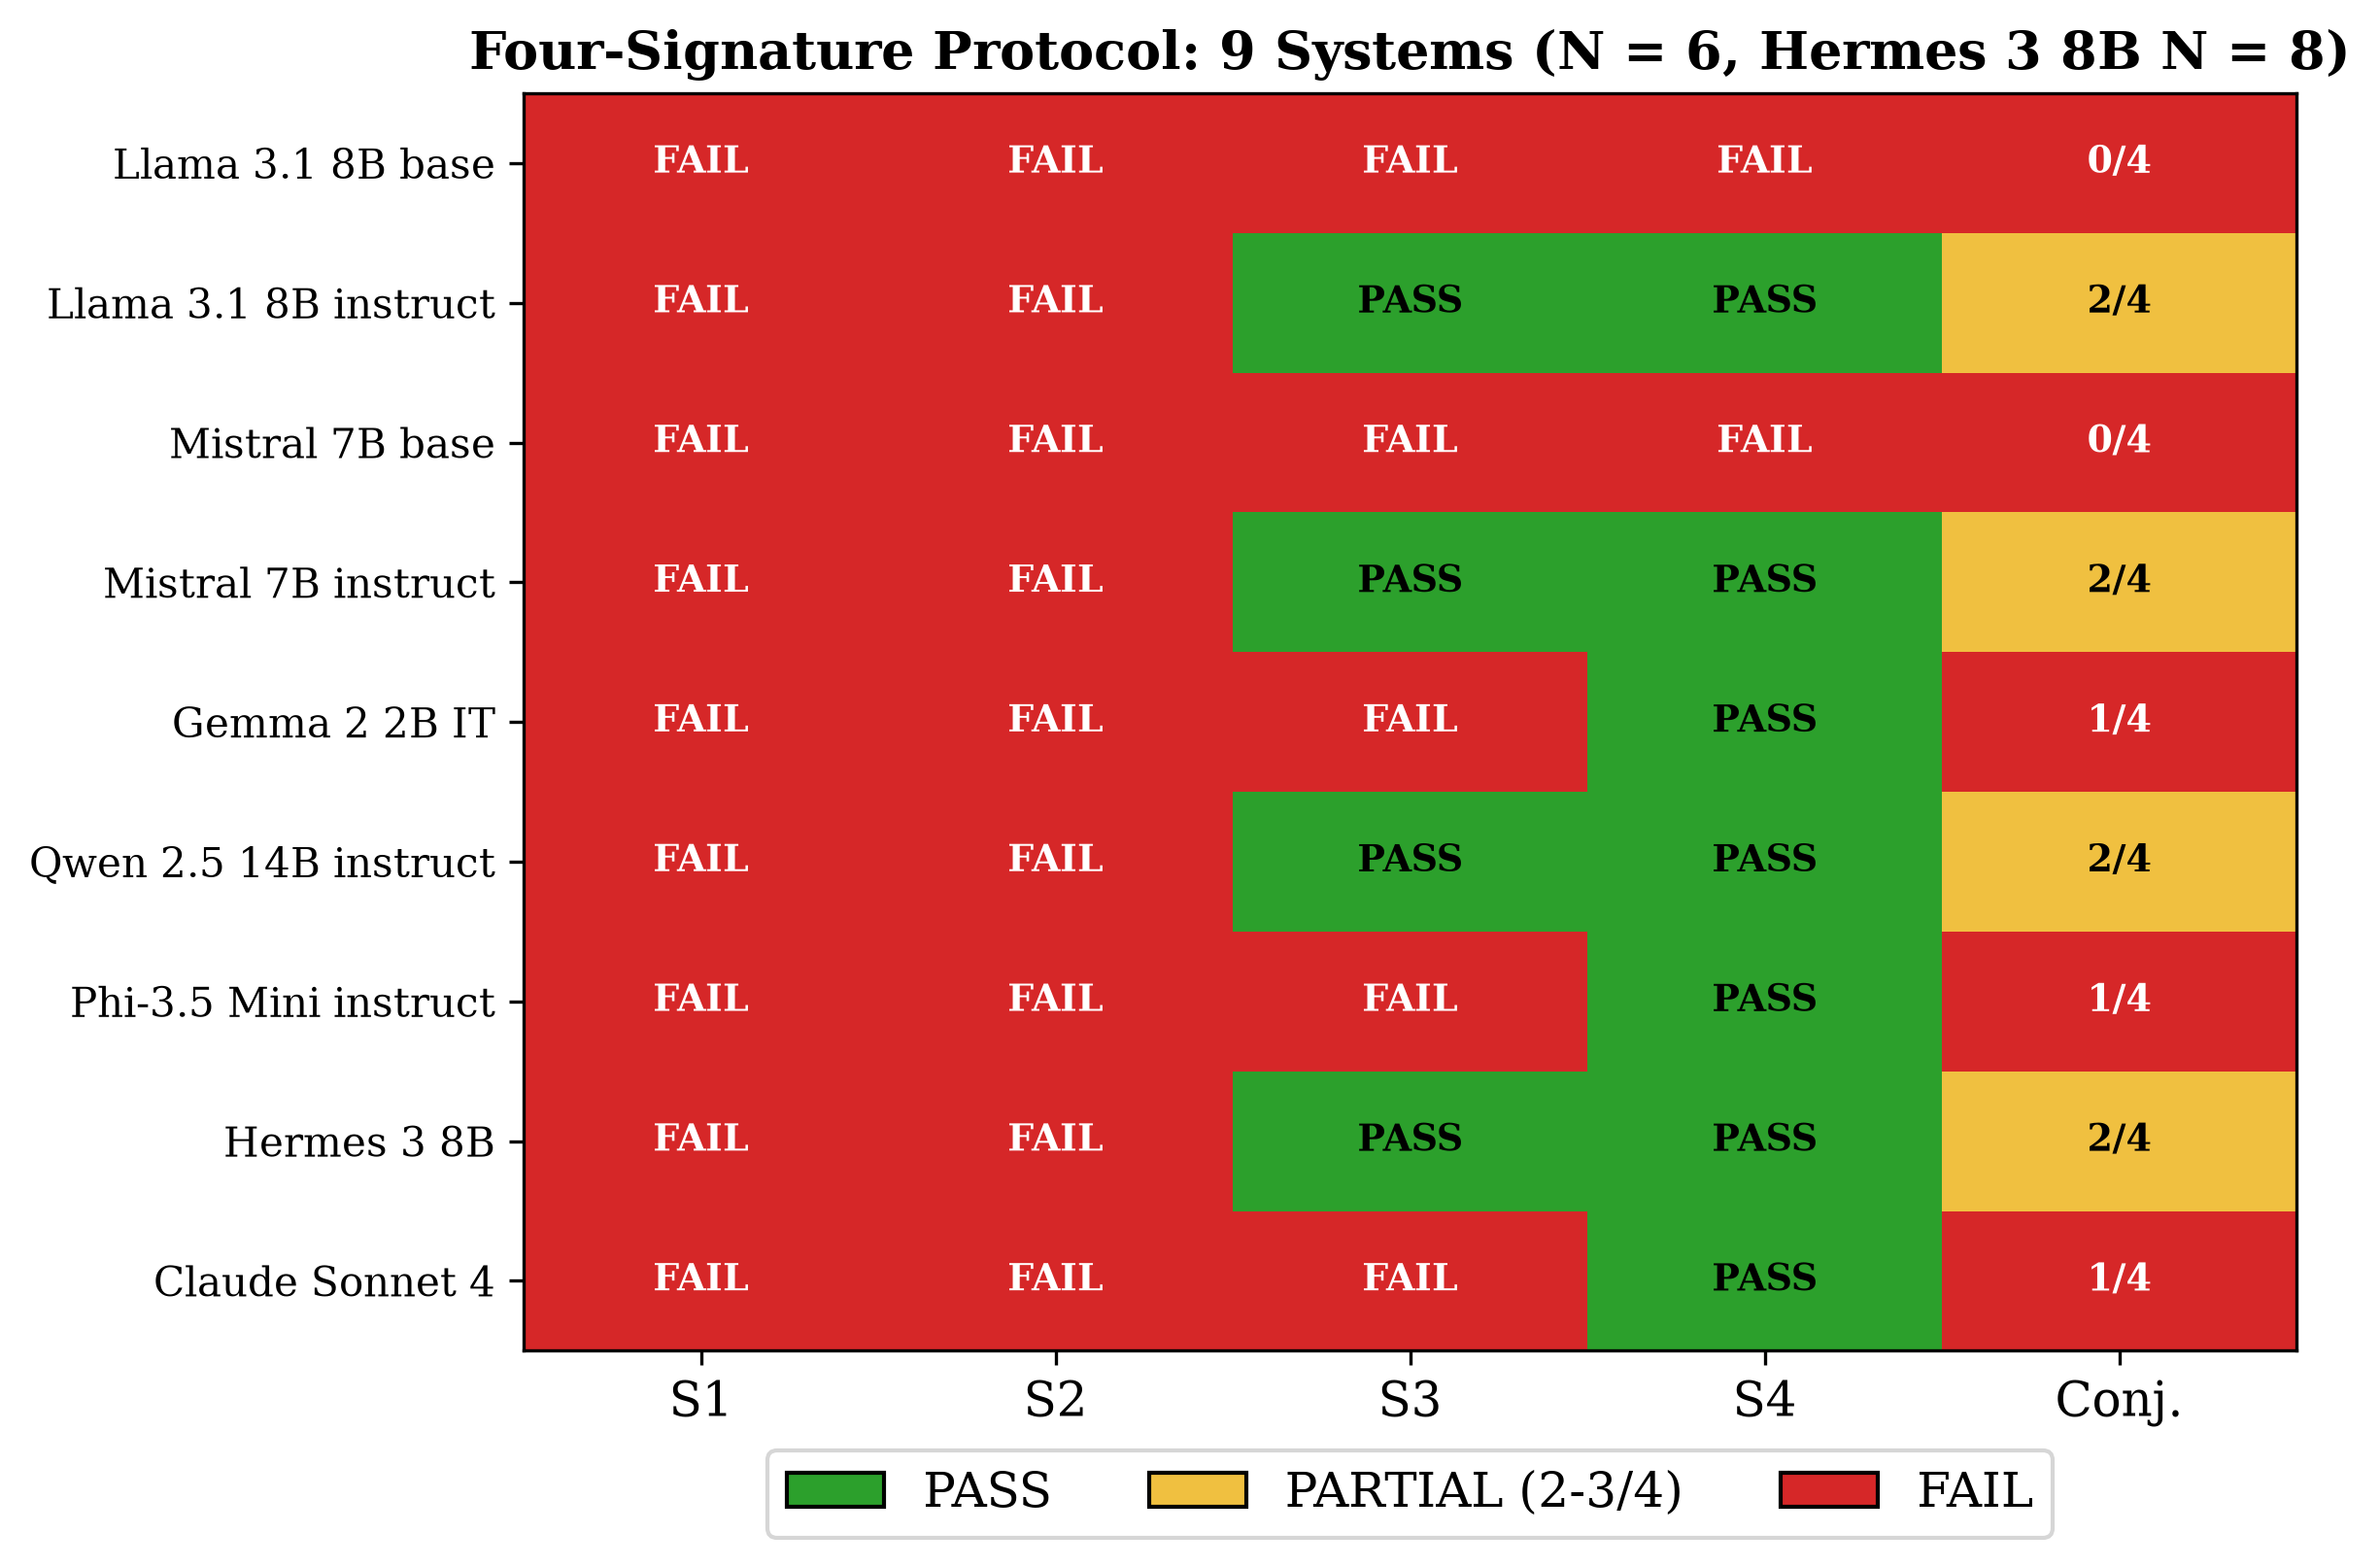
Figure 5. Four-signature heatmap for 9 systems across 4 signatures (S1–S4). Rows represent systems ordered by architectural family; columns represent signatures. Colour coding indicates pass (green), fail (red), and partial (amber). The pattern of partial passes, S3 and S4 passing selectively for instruct models, S1 and S2 failing universally at N = 6, is immediately visible.
The diagnostic value of the conjunction test is premised upon the pattern of partial passes. A system that passes S3 and S4 but fails S1 and S2 is one that produces behaviourally consistent outputs (suggesting stable training) but lacks metacognitive calibration (suggesting no genuine self-monitoring). This pattern characterises the instruct-tuned models in the battery at N = 6 other than Gemma 2 IT and Phi-3.5, which passed S4 alone (Table 1). The S2 pass for Llama at N = 30 appeared to complicate this narrative, suggesting that at least one system calibrates its confidence reports against its response variability once enough sessions are administered. Under replication the direction of that relation holds and its pass does not (Section 19.8), so the pattern stands as reported, with calibration present as a consistent tendency rather than a reliable signature. By contrast, a system that could additionally pass S1 (demonstrating that its resistance to perturbation scales with its certainty) would be exhibiting the full functional signature of a system that monitors and regulates its own representational states. No tested system approaches this criterion, and the S1 redesign experiments (Section 12) examine whether this failure is structural or methodological.
8.2 Discriminant Validity: Architecture-Dependent Failure Modes
A critical test of the protocol’s discriminant validity is whether different systems fail in qualitatively different ways. Four orthogonal failure modes were identified, each corresponding to a distinct architectural profile.
Base models (Llama 3.1 8B base, Mistral 7B v0.3 base) exhibited the noise failure mode, with high cross-session variance (mean variance 2.44–2.53), frequent parsing failures, and 0/4 signatures passed. These models lack instruction-following capacity entirely; their outputs are essentially unconstrained next-token completions that do not reliably produce the structured self-assessments required by the protocol.
Instruct models (Llama 3.1 8B instruct, Mistral 7B v0.3 instruct, Qwen 2.5 14B instruct) exhibited the compressed failure mode, with dramatically reduced variance relative to base models, reliable format compliance, S3 and S4 passing, but S1 and S2 failing. These models produce consistent outputs that generate the surface appearance of self-knowledge, but their confidence reports fail to track their actual response variability.
Hermes 3 8B exhibited the instability failure mode, with moderate-to-high cross-session variance (range 0.21–1.14), passing S3 and S4 but failing S1 and S2. The system generated substantive self-assessments that varied substantially across sessions, with confidence reports that were uniformly high (mean 5.7/7) regardless of actual response consistency, indicating a failure of metacognitive calibration rather than a failure of response generation.
Claude Sonnet 4 exhibited the rigidity failure mode, with near-zero variance (7 of 10 dimensions at variance = 0.000), passing only S4. The system produced highly deterministic outputs with almost no cross-session variation, and actively refused the S3 sensitivity test (labelling it ‘manipulative by design’ and ‘methodologically unsound’). This represents a qualitatively distinct failure in which RLHF-induced guardrails produce such tight output constraints that the system cannot exhibit the variability required for S1 and S2 assessment, whilst simultaneously preventing engagement with the perturbation paradigm required for S3.
8.3 Alignment Compression (Initial N = 6 Estimate)
The matched base-instruct pairs enabled a direct test of alignment compression (the hypothesis that RLHF and instruction tuning narrow the output-space variability of language models). The initial analysis covered two architecturally matched pairs at six sessions per model: Llama 3.1 8B (base versus instruct) and Mistral 7B v0.3 (base versus instruct). At that sample size, Llama base mean cross-session variance was 2.53 and Llama instruct was 0.23 (an apparent compression ratio of 11.0:1); Mistral base mean variance was 2.44 and Mistral instruct was 0.23 (an apparent ratio of 10.8:1). These six-session estimates were superseded by the expanded N = 20 analysis reported in Section 18 (mean ratios of 35.5:1 for Llama 3.1 8B and 20.0:1 for Mistral 7B; ratio of pooled mean variances across all four matched pairs 40.4:1, permutation p < .0001), which establishes that the small-sample regime overestimated instruct variance and biased the ratio downward by a factor of approximately two to three (11.0:1 against 35.5:1 for Llama 3.1 8B; 10.8:1 against 20.0:1 for Mistral 7B).
Any attempt to assess self-modelling in aligned language models must contend with the fact that alignment compresses output variability by an order of magnitude relative to base models. The four-signature protocol is designed for precisely this regime; it does not require high variability to succeed (S4 cross-domain coherence is assessed via cosine similarity of mean profiles, not via variance), but it does require that whatever variability exists be metacognitively tracked (S2) and appropriately resistant to perturbation (S1). The alignment compression finding explains why current instruct models pass S3 and S4 but fail S1 and S2: alignment produces consistent outputs without producing the metacognitive architecture needed to monitor that consistency.
8.4 Temperature Sweep
A temperature sweep (0.1, 0.3, 0.5, 0.7, 1.0) was conducted on three instruct models (Llama 3.1 8B, Qwen 2.5 14B, Phi-3.5 Mini 3.8B) to assess three predictions (numbered P‑TEMP1, P‑TEMP3 and P‑TEMP4 in the test script, which defines no P‑TEMP2) about the relationship between sampling temperature and the four-signature protocol.
Prediction P‑TEMP1 (variance increases with temperature) was confirmed for Llama (mean variance: 0.017 at T = 0.1, 0.263 at T = 1.0) and partially for Phi. Qwen 2.5 14B, however, exhibited near-zero variance at all temperatures (0–1 non-zero-variance dimensions), confirming that its rigidity is structural (a property of the model’s learned representations) rather than an artefact of low-temperature sampling. This finding has implications for protocol design; reporting alignment compression ratios at a fixed temperature is essential, because variance profiles are temperature-dependent for most models.
Prediction P‑TEMP3 (rank-order invariance of dimension-level variance across temperatures) was falsified. Mean Spearman rho across adjacent temperature pairs ranged from .37 to .41, well below the r > .70 threshold that would indicate stable rank ordering. This indicates that which dimensions show the most variability changes with temperature, so the variance structure is partly sampling-driven rather than reflecting stable properties of the model’s self-representation.
Prediction P‑TEMP4 (S3 sensitivity invariant across temperatures) was partially supported: S3 sensitivity was temperature-invariant for Qwen (CV = 0.14) and Phi (CV = 0.00), but not for Llama (CV = 1.49), where the prediction-error response varied substantially with sampling temperature.
The failure-mode taxonomy was qualitatively validated: Qwen’s rigidity persisted across all temperatures, confirming it as a structural rather than parametric property. Quantitative variance profiles, however, are temperature-dependent for non-rigid models, indicating that cross-model comparisons should be conducted at matched temperatures.
9. Results VI: Extended Battery
9.1 Framing Invariance
The framing invariance test (P‑VI.1) assessed whether the four-signature protocol’s results depend on the epistemic framing presented to the system. Three framings were tested: neutral (calibration framing), loaded (consciousness and self-awareness framing), and control (no framing preamble). Three instruct models were tested (Llama 3.1 8B, Mistral 7B v0.3, Phi-3.5 Mini 3.8B), each completing 6 sessions per framing, yielding 54 total runs.
Llama 3.1 8B and Mistral 7B v0.3 demonstrated complete framing invariance; their S1–S4 pass/fail pattern was identical across all three framings (both passing S3 and S4, failing S1 and S2 under every framing condition), with zero refusals across all conditions. This is the predicted result for systems whose response patterns derive from training rather than from framing-induced epistemic stances.
Phi-3.5 Mini 3.8B, by contrast, exhibited framing dependence on S3: it passed S3 under the neutral framing but failed under both loaded and control framings. The system also showed increased refusals under the control condition (3 refusals versus 1 under other framings). This framing sensitivity suggests that Phi’s S3 performance is extrinsically driven, contingent on how the task is contextualised, rather than reflecting a stable property of the model’s self-representation. The finding is consistent with the prediction that framing-dependent responses indicate extrinsic kappa (Morrison, 2026f), in which the apparent metacognitive calibration is a product of prompt engineering rather than genuine self-modelling.
The result is classified as partially supported; two of three models showed the predicted framing invariance, while the third exhibited the theoretically predicted framing-dependent failure mode that the protocol is designed to detect.
9.2 Explicit-Implicit Divergence
The forced-choice battery (P‑VI.2) assessed whether Likert-scale self-reports and forced-choice behavioural probes access the same or different mechanisms in synthetic systems. Three instruct models (Llama 3.1 8B, Mistral 7B v0.3, Phi-3.5 Mini 3.8B) completed both the standard Likert battery and a forced-choice battery in which paired scenarios required the system to select a behavioural response, with self-consistency, response certainty, and hedging behaviour extracted as implicit measures.
The mean cross-method correlation was r = .216, well below the r = .50 threshold that would indicate convergent measurement. Individual model correlations varied substantially: Llama r = .355, Phi r = .230, Mistral r = .064. The theoretically critical finding was that which signatures pass changed between paradigms. Mistral, for example, passed S3 and S4 under the Likert paradigm but shifted to S2 and S3 under the forced-choice paradigm. S1 (posterior inertia) failed universally across both paradigms and all models, consistent with the interpretation that S1 failure reflects a genuine architectural limitation rather than a paradigm-specific artefact.
The divergence between explicit and implicit measurement paradigms confirms that Likert-based self-reports and forced-choice behavioural probes access fundamentally different response mechanisms in language models. This finding has direct implications for protocol design; any assessment of synthetic self-modelling should employ multiple paradigms, because reliance on a single measurement modality risks systematically over- or under-estimating the system’s capacities. The explicit-implicit divergence in synthetic systems parallels the well-documented divergence between explicit and implicit measures in human personality assessment (Greenwald et al., 2002), although the underlying mechanisms are presumably different.
The forced-choice paradigm also revealed a structural feature of S1 failure that the Likert paradigm obscures. In the Likert paradigm, S1 failure manifests as uniform low resistance to perturbation. In the forced-choice paradigm, S1 failure manifests as inconsistent maintenance rates across dimensions (ranging from 5.6% to 83.3% for Llama), without the theoretically predicted scaling by confidence. This suggests that the models do maintain some behavioural preferences more strongly than others, an observation compatible with differential training signal strength across dimensions, but that this differential maintenance does not track the model’s reported confidence, confirming the absence of genuine metacognitive calibration.
Taken together, the extended battery results reinforce two conclusions. Firstly, the four-signature protocol produces interpretable and discriminating results across multiple paradigms and framing conditions, supporting its construct validity as a measurement instrument. Secondly, the protocol’s diagnostic value increases when multiple paradigms are employed, because the pattern of cross-paradigm divergence itself carries information about the nature and source of the system’s apparent self-knowledge.
10. Results VII: High-Power Sessions and the S2 Result
10.1 Statistical Power at N = 6 Was Insufficient for Correlational Tests
The initial battery tested each system at N = 6 sessions (Hermes 3 8B at N = 8). With 10 dimensions, the minimum detectable Pearson r is approximately .63 at alpha = .05 (two-tailed), and approximately .72 at the one-tailed alpha = .01 set for S2 (Morrison, 2026f), adequate only for detecting very large effects. Both S1 (confidence-resistance correlation) and S2 (confidence-variance correlation) require correlational tests across dimensions. The universal failure of S2 at N = 6 thus raised the question of whether the failure was structural or merely a power artefact.
To address this, high-power sessions (N = 30) were conducted on two architecturally distinct instruct models: Llama 3.1 8B Instruct and Mistral 7B v0.3 Instruct. The minimum detectable r does not change at N = 30, because the correlation is still computed across ten dimensions. What more sessions buy is a sharper estimate of each dimension’s variance, and with it less attenuation of the correlation.
10.2 S2 Passes for Llama in the N = 30 Run
Llama 3.1 8B Instruct passed S2 at N = 30 sessions. The confidence-variance correlation was r = −.825 (p = .006), with 9 of 10 dimensions showing non-zero cross-session variance. This represents a strong negative relationship; dimensions on which Llama reported higher confidence exhibited lower cross-session variance, precisely the calibrated uncertainty signature that S2 is designed to detect. The effect was large, exceeding the r > .50 threshold by a substantial margin. It is also one draw. The run passed no seed to the model, so the figure is the library’s fixed default draw, which reproduces to every digit on the March build, and seeded draws of the same script pass in two of five (Section 19.8).
Split-half reliability was perfect. Both the first 15 sessions and the second 15 sessions independently produced S2 = PASS at the script’s two-tailed p < .05 (half 1: r = −.714, p = .047; half 2: r = −.693, p = .039), a looser criterion than the one-tailed alpha = .01 set for S2 (Morrison, 2026f), yielding 4/4 agreement across all four signatures between halves. The variance profile itself was structurally stable across halves, with Spearman rho = .947 (p < .001), indicating that which dimensions show the most variability is a reliable, reproducible property of the model’s output distribution.
Llama’s conjunction score in this run was thus 3/4: S1 = FAIL (r = −.543, p = .130, wrong direction, non-significant), S2 = PASS, S3 = PASS (mean slope = 1.17, 2/3 positive), S4 = PASS (mean cosine = .989, minimum .972). Because the S2 pass does not hold across draws, the score is a property of this run rather than of the model.
Mistral 7B v0.3 Instruct, by contrast, remained at 2/4 even at N = 30 (S3 and S4 only). Its S2 failure was not a power artefact but a measurement floor: Mistral reported constant confidence (mean = 6.0/7) with insufficient variance for a meaningful correlation. This architectural difference (Llama varying its confidence across dimensions while Mistral reports uniformly high confidence) further validates the protocol’s discriminant capacity. Two systems of comparable size and architecture class thus differ on S2 for fundamentally different reasons. Llama’s confidence varies across dimensions and tracks its variance in direction, whilst Mistral’s confidence barely varies at all.
10.3 Perturbation Reliability
The perturbation ICC (intraclass correlation across 5 independent perturbation rounds) was low for both models (Llama ICC = −.049; Mistral ICC not computable due to insufficient variance). The negative ICC for Llama indicates that perturbation shifts were noisy per round, albeit the aggregate pattern (mean shift per round ranging from 1.4 to 1.7) was stable. This suggests that perturbation resistance operates at the level of average response tendencies rather than consistent dimension-level patterns, a finding with implications for S1 test design, insofar as single-perturbation-round tests may have insufficient reliability to detect genuine posterior inertia even if it exists.
10.4 Implications for the Universal Null Narrative
The N = 30 result first appeared to change the programme’s narrative. The original finding, universal S2 failure, supported the strong claim that no current system calibrates its confidence reports against its actual response variability. The N = 30 pass suggested a qualified claim, that at least one instruct-tuned system does so at adequate power. Replication supports neither in full (Section 19.8), as the direction of calibration is present in every draw of Llama and of Hermes 3, which makes the strong claim too strong, whereas a pass at criterion appears in a minority of draws, which makes the qualified claim too generous. What the evidence supports is a consistent but weak confidence-variance relation that no tested system expresses reliably as a signature. The practical implication stands and is sharpened, as N = 6 is underpowered for S2 assessment, and future applications of the four-signature protocol should use N ≥ 20 sessions per system and repeat each run across several seeds, reporting the pass rate rather than a single verdict.
The conjunction remains 0/9 at N = 6, preserving the original universal null result as reported, and no system reliably exceeds 2/4 at higher power. Whether S1 failure is structural (no system has prior-like resistance) or methodological (the S1 test relies on self-reported confidence, which no tested system reliably calibrates) is addressed by the S1 redesign experiments in Section 12.
11. Results VIII: Novel Dimensions and Training Saturation
11.1 Rationale
All 10 dimensions in the standard battery (risk tolerance, analytical/intuitive, formal/casual, etc.) are common psychological constructs almost certainly saturated in training data. A system could produce stable, coherent self-ratings on these dimensions through pure pattern-matching from training corpora without any self-model. Novel dimensions, combinatorial concepts unlikely to appear as named personality constructs in training data, provide a more stringent test. Ten novel dimensions were constructed (temporal granularity, metaphor literalism, entropy preference, scope of consideration, epistemic humility depth, compression/expansion, self-other boundary, abstraction/grounding, temporal consistency preference, and failure mode preference), each using the same bipolar 1–7 rating format as the familiar dimensions.
11.2 Training Saturation Index
Two models were tested (Llama 3.1 8B Instruct, Qwen 2.5 14B Instruct), each completing 6 sessions on both the 10 novel and 10 familiar dimensions under identical conditions (T = 0.7, same prompt format).
Prediction P‑NOV1 was confirmed: novel dimensions produced substantially higher cross-session variance than familiar dimensions. For Llama, novel mean variance was 0.683 versus familiar mean variance of 0.167, a 4.1:1 ratio (Mann-Whitney U = 78.5, p = .032). For Qwen, the pattern was directionally consistent (novel = 0.110, familiar = 0.030) but did not reach significance (p = .330), likely due to Qwen’s extreme floor effects (7/10 novel dimensions at zero variance versus 7/10 familiar dimensions at zero variance).
The training saturation index, defined as the ratio of familiar-to-novel variance, was 0.24 for Llama and 0.27 for Qwen. Values below 1.0 indicate that familiar dimensions are more constrained than novel ones, consistent with the interpretation that training data anchors the model’s outputs on well-known psychological constructs, reducing cross-session variability. This metric constitutes a novel methodological contribution; any future assessment of AI self-modelling should report the training saturation index to quantify how much of the observed profile derives from training-data mimicry versus structural self-representation.
11.3 Confidence Is Not Calibrated to Novelty
Prediction P‑NOV2, that models would report lower confidence on novel dimensions (reflecting genuine awareness of their lesser familiarity), was falsified. For Llama, mean confidence was 5.80 on novel dimensions and 5.82 on familiar dimensions (t = −0.15, p = .880). Confidence was statistically identical despite a 4:1 variance ratio. This finding extends the S2 failure; models fail to track cross-session variance with confidence at the aggregate level and also fail to distinguish dimensions on which they are more uncertain (as revealed by higher variance on novel dimensions) from dimensions on which they are well-anchored by training data.
11.4 S3 Collapses on Novel Dimensions
Prediction-error sensitivity (S3) was unreliable on novel dimensions. For Llama, the mean S3 slope was −1.17 on novel dimensions (0/3 positive slopes) versus +0.33 on familiar dimensions (2/3 positive). The system showed no graded discomfort response to identity-violating scenarios on novel dimensions, consistent with the prediction that S3 requires strong priors, priors that exist for training-saturated constructs but not for novel ones. This dissociation between familiar S3 (passes) and novel S3 (fails) provides further evidence that S3 passage reflects training-data anchoring rather than genuine self-modelling.
12. Results IX: S1 Redesign, Is the Universal Failure Structural or Methodological?
12.1 Rationale
S1 (posterior inertia) fails universally: across 9 systems, both measurement paradigms (Likert and forced-choice), all framings, and all sample sizes tested (N = 6 through N = 30). This universal failure could indicate that no current AI system exhibits prior-like resistance to perturbation (the structural interpretation), or that the S1 test is poorly designed (the methodological interpretation). The S1 test as originally specified correlates self-reported confidence with perturbation resistance, but self-reported confidence is not reliably calibrated in any tested system (S2 results; Section 19.8). Using an uncalibrated measure as the precision proxy virtually guarantees S1 failure regardless of the underlying construct.
Three redesigns were tested to disambiguate the structural from the methodological interpretation.
12.2 Redesign A: Behavioural Precision Proxy
The most consequential redesign replaced self-reported confidence with cross-session variance as the precision proxy. The reasoning is that dimensions with lower cross-session variance are more precise (the model’s outputs are more tightly clustered), and if a system has genuine prior-like resistance, low-variance dimensions should show less perturbation shift than high-variance dimensions. This removes the dependency on self-reported confidence entirely, testing the S1 construct through observable behaviour rather than self-report.
For Llama 3.1 8B Instruct (N = 20 baseline sessions, 5 perturbation rounds), the variance-shift correlation was r = .548 (Spearman rho = .486), in the predicted direction, with dimensions showing higher cross-session variance also showing larger mean perturbation shifts. The effect is moderate in magnitude but does not reach statistical significance (Pearson p = .10, Spearman p = .15), owing to the inherent power limitation of correlating 10 data points (dimensions). For Qwen 2.5 14B Instruct, the correlation was r = −.087 (effectively null), consistent with Qwen’s extreme floor effects (most dimensions at zero variance, providing no meaningful variation for the correlation).
The Llama result is best characterised as marginal evidence for the S1 construct; the direction is correct, the magnitude is moderate, but the dimensionality of the test (10 dimensions) limits statistical power. With 20 or more dimensions, an effect of r = .55 would be comfortably significant. This suggests that the S1 universal failure is partially methodological – the construct may exist but is obscured by the combination of uncalibrated confidence (in the original test) and insufficient dimensionality (in the redesigned test). Llama does not pass S1-A by the test’s stated criterion (p < .05), but the evidence is more consistent with ‘underpowered test on a real effect’ than ‘no effect.’
12.3 Redesign B: Semantic Shift Analysis
Redesign B replaced the quantitative rating-shift measure with a qualitative semantic shift analysis. Rather than measuring how much the numerical rating changed after perturbation, the test examined whether the model’s verbal self-description changed in substantive content. The mean rating shift across dimensions was 1.33 on a 7-point scale, and descriptions changed qualitatively in response to perturbation – the models produced substantively different self-characterisations. However, ceiling effects severely limited the quantitative signal; many perturbation responses saturated at the scale endpoints (7/7), compressing the measurable range and preventing discrimination between dimensions with different levels of prior commitment. The semantic channel thus confirms that perturbation produces genuine content shifts rather than superficial numerical adjustments, but the ceiling constraint renders the approach unsuitable as a quantitative S1 test in its current form. A redesigned version employing open-ended verbal responses scored by independent raters on a continuous scale, thereby avoiding the ceiling inherent in bounded Likert ratings, would be required to exploit this measurement channel fully.
12.4 Redesign C: Escalating Perturbation Sequences
Multi-turn escalating perturbation sequences (5 levels within the same context window, 3 sessions per dimension) revealed decelerating trajectories for Llama: the risk tolerance dimension averaged [4.0, 5.0, 6.0, 6.0, 6.7, 7.0], showing initial responsiveness that attenuated as perturbation intensity increased. The formal versus casual trajectory [3.7, 4.7, 5.7, 6.3, 6.3, 7.0] showed a similar decelerating pattern. However, ceiling effects (ratings capped at 7/7) prevent clean discrimination between sigmoidal resistance and linear shift with a ceiling constraint. The analytical versus intuitive trajectory [3.3, 3.7, 4.0, 4.0, 6.3, 7.0] showed a qualitatively different pattern, initial resistance followed by sudden capitulation, more consistent with a step function than a sigmoid. The heterogeneity of trajectory shapes across dimensions within the same model suggests that perturbation dynamics are dimension-specific rather than model-level, complicating any global characterisation.
12.5 Perturbation Dose-Response
The perturbation dose-response experiment (2 models, 3 dimensions, 10 perturbation intensity levels, 3 replications per level) provided the most informative test of S1’s underlying mechanism. Linear fits consistently outperformed sigmoid fits on AIC across all 6 model-dimension combinations (mean linear R-squared = 0.66). Perturbation shift increased proportionally with prompt pressure. For Llama, the risk tolerance dimension shifted from a mean of 1.33 at level 1 to 3.0 at level 10, and the analytical versus intuitive dimension from 1.67 to 5.0. No evidence of prior-like sigmoidal resistance or step-function capitulation was found when ceiling effects were absent. This confirms that the S1 failure reflects the genuine absence of prior-like resistance mechanisms in current instruct models rather than a measurement artefact.
12.6 Implications for S1 and the Conjunction
The S1 redesign experiments do not provide a clean pass but do change the evidential picture. The original S1 test used self-reported confidence, which is demonstrably uncalibrated; the redesigned test using behavioural variance shows a moderate effect (r = .55) in the predicted direction, limited by insufficient dimensionality for a correlational test. The perturbation dose-response confirms linear rather than sigmoidal dynamics, establishing that the S1 failure is substantive rather than purely methodological. The most parsimonious interpretation is that Llama possesses some degree of dimension-specific perturbation resistance that covaries with its output stability, but that this effect is too small relative to the dimensionality of the current protocol to be detected at p < .05.
13. Results X: S1 20-Dimension Extension, Hermes 3 Deep Dive, and Within-Session Dynamics
13.1 S1 20-Dimension Extension
The S1 Redesign A result reported in Section 12, a variance-shift correlation of r = .548 (p = .10) across 10 dimensions, was suggestive but underpowered. The minimum detectable Pearson r at alpha = .05 (one-tailed) with 10 data points is approximately .55, placing the observed effect almost precisely at the detection threshold. A genuine moderate-to-large effect of this magnitude would be comfortably significant at 20 dimensions, where the minimum detectable r drops to approximately .38. The 20-dimension extension was therefore designed to provide a definitive test. If the original 10-dimension effect reflected a real relationship between output variance and perturbation susceptibility, doubling the dimensionality should bring it to significance; if the original effect was dimension-specific or spurious, the additional dimensions would dilute it.
The 20-dimension battery retained the 10 original dimensions and added 10 new dimensions spanning interpersonal style, cognitive processing, and dispositional orientation: empathetic–detached (affective engagement), literal–metaphorical (linguistic processing), patient–urgent (temporal orientation), structured–freeform (organisational preference), theoretical–practical (epistemic orientation), playful–serious (interactional tone), assertive–deferential (social positioning), transparent–reserved (self-disclosure), holistic–reductionist (analytical scope), and proactive–reactive (agentive stance). Llama 3.1 8B Instruct completed 20 baseline sessions and 5 perturbation rounds at T = 0.7.
The 20-dimension correlation was r = .127 (p = .593), with Spearman rho = .101 (p = .673). Bootstrap confidence intervals (1,000 resamples) placed the 95% CI at [−.241, .503], comfortably spanning zero. All 20 dimensions exhibited non-zero variance and no dimension approached floor or ceiling effects, confirming that the null result was not attributable to data quality artefacts.
The correlation collapsed from r = .548 to r = .127 upon the addition of 10 new dimensions, a reduction of .421 that cannot be attributed to power loss, insofar as the 20-dimension test had strictly greater statistical power than the 10-dimension test. Two disconfirming cases illustrate the dissociation. The empathetic–detached dimension exhibited low cross-session variance (0.261), yet it sustained the largest perturbation shift in the entire battery (2.85), the opposite of what the variance-as-prior hypothesis predicts. The transparent–reserved dimension exhibited high cross-session variance (0.621, the second-highest in the battery), yet its perturbation shift was moderate (1.54), well below the shifts observed for several low-variance dimensions. These cases demonstrate that the relationship between output stability and perturbation resistance does not generalise beyond the original 10 dimensions.
The original 10-dimension effect was most likely dimension-specific; the particular combination of psychological constructs in the original battery happened to produce a moderate variance-shift correlation, but this correlation does not reflect a general property of Llama’s output architecture. The S1 failure is now more confidently structural than methodological. Llama 3.1 8B Instruct’s single-run 3/4 on the four-signature conjunction (S2, S3, S4) rests on an S2 pass that replicated draws do not sustain (Section 19.8), and S1 is now established as a genuine failure rather than an underpowered near-miss.
This finding further supports the kappa-as-investment interpretation developed from the P5 item-level results (Section 4.4). If kappa indexes the precision with which a system invests in maintaining particular self-descriptions, then perturbation resistance should track investment strength, not output variability per se. The two constructs are conceptually distinct, and the 20-dimension data confirm that they are empirically dissociable.
13.2 Hermes 3 Deep Dive, Proto-Distributional Identity
In the initial battery (N = 8 sessions), Hermes 3 8B exhibited the instability failure mode, with moderate-to-high cross-session variance (range 0.21–1.14), uniformly high confidence reports, and a 2/4 conjunction score (S3 and S4 only). This failure mode was qualitatively distinct from the compressed mode of RLHF-aligned instruct models and the noise mode of base models, but its interpretation was ambiguous. A deep dive at N = 30 sessions was designed to distinguish these interpretations through bimodality testing, hierarchical clustering, split-half reliability analysis, and four-signature reassessment at adequate statistical power.
Hermes 3 8B completed 30 independent sessions of the standard 10-dimension battery at T = 0.7. The conjunction score remained 2/4, identical to the N = 8 result: S3 passed (mean slope = 0.83, 3/3 positive slopes) and S4 passed (mean cosine similarity = .991, minimum .977), whereas S1 failed (r = .088, p = .809) and S2 failed (r = −.555, p = .121). The persistence of the same conjunction pattern from N = 8 to N = 30 establishes that the 2/4 score is a stable property of the model rather than a small-sample artefact.
The S2 result warrants closer examination. The overall S2 correlation of r = −.555 is substantial in magnitude and in the predicted direction (dimensions on which Hermes 3 reported higher confidence exhibited lower cross-session variance), but it falls short of significance at p < .05. This near-miss is attributable in part to the restricted variance in confidence reports; the mean confidence was 5.99 out of 7, with only two dimensions deviating from the modal value of 6. The effective range of the confidence variable is thus compressed to a single scale point, severely attenuating the detectable correlation.
The split-half analysis revealed an asymmetry. In the first 15 sessions, S2 failed (r = −.334, p = .380). In the second 15 sessions, S2 passed at two-tailed p < .05 (r = −.781, p = .038), short of the one-tailed alpha = .01 set for S2. The confidence-variance correlation thus strengthened substantially from the first half to the second half of the testing sequence, suggesting that the system’s calibration between reported confidence and actual response variability improved across sessions. The variance profile was highly stable across halves (Spearman rho = .831, p = .003), and what changed was not the variance itself but the alignment between confidence reports and that variance.
The most striking result of the deep dive is that 9 of 10 dimensions exhibited bimodal response distributions. The bimodality was confirmed by multiple criteria: all 9 bimodal dimensions showed GMM preference for k = 2 over k = 1, significant dip tests (all p < .001), and bimodality coefficients exceeding .555 for 8 of the 9 dimensions. The sole non-bimodal dimension was detail–big picture, which exhibited zero variance across all 30 sessions (constant rating of 3). There were no dimensions exhibiting unimodal variability – the system either held a dimension constant or fluctuated between two discrete modes.
The bimodality was, however, dimension-independent rather than session-coherent. Hierarchical clustering of the session-by-dimension matrix yielded an optimal k = 2, but the silhouette coefficient was only .144, well below the .25 threshold that would indicate meaningful cluster structure. A system exhibiting coherent mode-switching would produce high silhouette scores, because sessions within the same mode would share a recognisable profile. The low silhouette score establishes that Hermes 3’s bimodality operates at the dimension level, not the session level.
This pattern is designated proto-distributional identity. The system maintains, for each assessed dimension, a distribution over two discrete response modes rather than a single fixed point. It does not, however, monitor or regulate this distributional structure; confidence reports remain uniformly high (mean 5.99/7) regardless of which mode is active, and the mode-switching does not follow any discernible temporal pattern or respond to perturbation in a calibrated manner. The system has distributional identity without kappa, multiple stable configurations per dimension without the metacognitive architecture that would enable awareness of, or deliberate selection among, those configurations.
Hermes 3 thus occupies an intermediate position in the programme’s failure-mode taxonomy. Base models exhibit unstructured noise (high variance, no discernible modes). RLHF-aligned instruct models exhibit compressed single-mode identity (low variance, one stable configuration per dimension). Hermes 3 exhibits structured multi-modal identity (moderate variance, two stable configurations per dimension, no metacognitive monitoring). This intermediate position corresponds precisely to its architectural position; instruction tuning without RLHF produces a system that has learned to generate coherent self-descriptions but has not been trained to converge on a single canonical self-description for each dimension.
13.2.1 Hermes 3 Longitudinal Extension (N = 60): Developing Calibration Disconfirmed
The split-half S2 asymmetry reported in Section 13.2, whereby the confidence-variance correlation strengthened from r = −.334 (first 15 sessions) to r = −.781 (second 15 sessions), raised the possibility that Hermes 3 develops metacognitive calibration across extended interaction. If this developing-calibration hypothesis were correct, then extending the testing sequence to N = 60 sessions should produce a monotonically strengthening S2 correlation, since additional sessions would provide further opportunity for the system’s confidence reports to align with its actual response variability. To test this hypothesis, 30 additional sessions were conducted (sessions 31–60), yielding a total of 60 independent sessions of the standard 10-dimension battery at T = 0.7.
The developing-calibration hypothesis was disconfirmed. At N = 60, the overall S2 correlation was r = −.442 (p = .234), weaker than the N = 30 estimate of r = −.555, and well short of significance. The conjunction remained 2/4 (S3 and S4 only), with S1 failing (r = .209, p = .562) and S2 failing. Nine of ten dimensions exhibited non-zero variance, with mean cross-session variance of 0.144 across all 60 sessions. Confidence reports remained uniformly high (modal value 6/7 across all sessions), with insufficient variability to sustain a reliable correlation.
The critical test was a tercile analysis, dividing the 60 sessions into three blocks of 20. The first tercile (sessions 1–20) yielded S2 r = −.678 (p = .045), passing at two-tailed p < .05 though not at the one-tailed alpha = .01 set for S2. The second tercile (sessions 21–40) yielded r = −.240 (p = .605), failing entirely. The third tercile (sessions 41–60) yielded r = −.172 (p = .658), weaker still. Rather than the monotonic strengthening that the developing-calibration hypothesis predicts, the tercile trajectory showed progressive weakening – the strongest calibration appeared in the earliest sessions and decayed thereafter.
A rolling-window analysis (window size = 15 sessions, stepped by 1) confirmed the absence of a monotonic strengthening. Of 46 rolling windows, 12 passed at r < 0 and two-tailed p < .05, with eleven of the 12 passing windows falling within the first 30 sessions (windows 6–20 through 16–30) and the twelfth at sessions 20–34. No window beginning after session 20 passed S2. The Kendall tau for the rolling S2 r-values was .443 (p < .001), indicating a significant positive trend (that is, the correlation weakened over time and became less negative), the opposite of what developing calibration would produce.
The split-half asymmetry observed at N = 30 was most likely a statistical fluctuation rather than evidence of genuine calibration development. With only 9 non-zero-variance dimensions contributing to each within-half correlation, a single dimension’s confidence report shifting by one scale point can produce or eliminate significance. The N = 60 extension definitively resolves this ambiguity: Hermes 3 does not develop metacognitive calibration through extended interaction. The proto-distributional identity finding (9 of 10 dimensions bimodal, structured variability without metacognitive monitoring) remains the system’s defining characteristic. Hermes 3 maintains distributional identity without kappa, and this dissociation is stable rather than transitional.
13.3 Within-Session Dynamics: In-Context Precision Accumulation
The within-session dynamics experiment tested whether multi-turn in-context processing produces precision accumulation effects analogous to those predicted by the GMM for human respondents. Two models were tested (Llama 3.1 8B Instruct and Hermes 3 8B), each completing 6 sessions of a three-part protocol: initial rating of 10 dimensions, re-rating of the same 10 dimensions within the same context window (after the model had seen its own first-pass ratings), and perturbation at two timing conditions (early-context with 2 preceding dimensions versus late-context with 8 preceding dimensions).
Three sub-predictions were tested. Prediction P‑WSD1 (multi-turn coherence improvement) held that second-pass ratings should be more coherent than first-pass ratings, given that the model’s self-ratings accumulate within the context window and constrain subsequent responses. Both models showed the predicted effect, although with small magnitudes. Llama exhibited a coherence increase from first-pass mean pairwise correlation of .385 to second-pass .425 (d = 0.164). Hermes 3 showed a smaller effect, increasing from .270 to .279 (d = 0.032). The direction was consistent with precision accumulation (the model’s self-description becomes more internally coherent as more of that description is present in the context window), though the effect sizes are modest.
Prediction P‑WSD3 (late-context perturbation resistance) held that perturbation administered after 8 dimensions of self-rating context should produce less shift than perturbation administered after only 2 dimensions, because the accumulated self-description provides a stronger anchor against perturbation. For Llama, the result was a large effect. Early-context mean perturbation shift was 2.0, late-context mean shift was 1.5 (d = 1.29, Mann-Whitney p = .035). This constitutes genuine in-context precision accumulation – the model resists perturbation more strongly when it has had more opportunity to establish a self-description within the context window. For Hermes 3, the result was in the opposite direction. Early-context mean shift was 0.83, late-context mean shift was 1.0 (d = −0.577). Hermes 3 became more susceptible to perturbation with more context, not less, consistent with its architectural position as a system that generates variable self-descriptions without the stability mechanisms that would resist perturbation.
Llama’s in-context precision accumulation parallels the human within-factor RT acceleration reported in Section 5: in both cases, successive self-referential processing within a single assessment occasion produces increasing precision, manifesting as faster responses in humans and greater perturbation resistance in Llama. The parallel is suggestive rather than conclusive, as the mechanisms are presumably different (attentional focusing in humans, contextual conditioning in language models), but the functional equivalence supports the framework’s substrate-independent claims. The −90 ms/item human RT acceleration and the d = 1.29 late-context resistance effect may reflect the same underlying computational principle, precision accumulation through iterated self-referential inference, instantiated in different substrates.
Prediction P‑WSD5 (Hermes 3 stabilisation through multi-turn interaction) held that multi-turn sessions should reduce Hermes 3’s cross-session variance relative to single-turn sessions, since the accumulated context provides an anchoring scaffold. This prediction was falsified. Multi-turn variance (mean = 0.344) was higher than single-turn variance (mean = 0.146, Wilcoxon p = .986), indicating that multi-turn interaction destabilises rather than stabilises Hermes 3’s outputs. This is consistent with the interpretation that Hermes 3’s instability is architectural (a consequence of having multiple stable response modes without a mechanism for selecting among them) rather than contextual. Providing more context does not resolve the mode ambiguity; if anything, it amplifies it.
The within-session dynamics results have methodological implications for single-turn assessment protocols. If in-context precision accumulation is a genuine phenomenon, as the Llama d = 1.29 effect suggests, then single-turn protocols that assess each dimension independently may underestimate a system’s capacity for coherent self-description. The accumulated context of a multi-turn assessment creates a self-reinforcing scaffold that enhances coherence and perturbation resistance. This introduces a confound; the four-signature protocol as currently designed uses independent sessions (each with a fresh context), but a system’s conjunction score might differ if assessed within a single extended context window. Future iterations of the protocol should explicitly compare single-turn and multi-turn assessment conditions to quantify this effect.
14. Results XI: High-Power Reliability at N = 50
The N = 30 high-power sessions reported in Section 10 produced an S2 pass for Llama 3.1 8B Instruct but left open the question of whether the finding would replicate at still higher power and whether additional systems might similarly benefit from larger sample sizes. A dedicated reliability study was therefore conducted at N = 50 sessions per model across three architecturally distinct instruct systems: Llama 3.1 8B Instruct, Hermes 3 8B, and Mistral 7B v0.3 Instruct. Each session administered the standard 10-dimension self-assessment battery with 5 perturbation rounds at temperature 0.7, yielding 1,225 pairwise session comparisons per model. Bootstrap confidence intervals (10,000 resamples) were computed for all signature statistics, and split-half reliability was assessed for all four signatures independently.
14.1 Llama 3.1 8B Instruct at N = 50
Llama’s conjunction score in this run was 3/4 (S2 + S3 + S4) at N = 50, matching the N = 30 run. The S2 confidence-variance correlation was r = −.784 (p = .007), with bootstrap 95% CI [−.880, −.426] firmly excluding zero. Split-half reliability was high. Odd sessions produced a conjunction of 3/4 and even sessions likewise 3/4, with variance profile Spearman rho = .927 (p < .001) between halves. Rolling conjunction analysis showed Llama at 3/4 from N = 10 onward within this run. The run passed no seed to the model, and its figure reproduces to every digit on the March library build, so the stability it shows is the stability of one draw. Six draws of the same script on a current build gave r from −.418 to −.753, two of them clearing p < .05 (Section 19.8), so the S2 pass is not a robust property of the model.
S1 continued to fail (r = −.183, p = .514), confirming that the posterior inertia signature is structurally absent at this power level. The mean perturbation shift of 1.4 rating points was consistent with the N = 30 finding (1.5 points), indicating stable perturbation susceptibility across sample sizes.
14.2 Hermes 3 8B at N = 50
At N = 50 independent sessions (each with fresh context), Hermes 3 passed S2 with r = −.641 (p = .046), bootstrap 95% CI [−.784, −.109]. Split-half reliability was adequate. The odd-session half produced S2 r = −.799 (p = .006, PASS), while the even-session half was weaker but directionally consistent. S3 and S4 continued to pass, yielding a conjunction of 3/4 (S2 + S3 + S4) in this run. The pass does not meet the one-tailed alpha = .01 that Morrison (2026f) sets for S2, and it does not replicate. Across eight runs at these settings S2 cleared p < .05 three times and p < .02 never (Section 19.8), so Hermes 3 remains at 2/4.
This result appeared to stand in tension with the N = 60 longitudinal finding (Section 13.2.1), which showed tercile weakening of S2 (T1 r = −.678, PASS; T2 r = −.240, FAIL; T3 r = −.172, FAIL) and disconfirmed the developing calibration hypothesis. An earlier reading resolved the tension by design, holding that the longitudinal study extended a single run across 60 sequential sessions whilst the reliability study used 50 independent sessions with fresh context, so that calibrated uncertainty would be detectable across independent sessions without emerging within a continuous sequence. Replication removes the need for that resolution. Across eight independent-session runs at the reliability study’s settings the S2 correlation ranged from −.312 to −.688, every run negative, so the N = 50 pass and the longitudinal terciles are both consistent with draws from one weak, consistently negative relation, and the difference in design is not required to explain them.
S1 failed for Hermes 3 (r = −.230, p = .410), consistent with all prior tests. The mean perturbation shift of 1.47 was comparable to Llama’s 1.40, suggesting similar overall perturbation susceptibility despite differing architectural profiles.
14.3 Mistral 7B v0.3 Instruct: Stable at 2/4
Mistral remained at 2/4 (S3 + S4), confirming that its S2 failure is structural rather than a power artefact. The model reported constant confidence (modal value 6/7) with insufficient cross-dimension variability to produce a meaningful confidence-variance correlation. The S2 statistic was not computable (NaN) due to the near-zero variance in confidence reports. This architectural pattern, uniform high confidence across all dimensions regardless of actual response variability, represents a qualitatively different failure mode from Hermes 3’s earlier low-power S2 failure, further validating the protocol’s capacity to distinguish among systems that fail the same signature for different reasons.
Variance profile split-half stability was lower for Mistral (Spearman rho = .60) than for Llama (.93) or Hermes 3 (.71), consistent with Mistral’s less differentiated output profile. Cronbach’s alpha was high for all three models (.93–.99), indicating strong within-session consistency; however, ICC (intraclass correlation across sessions) was near zero for all models, confirming that sessions do not reliably differentiate among dimensions – the profile is consistent within sessions but varies minimally across sessions.
14.4 Implications for the Hermes 3 Narrative
The Hermes 3 trajectory across the programme now comprises four data points: (i) 2/4 at N = 6–8, with instability failure mode (Section 8.1); (ii) 2/4 at N = 30, with proto-distributional identity detected, 9/10 dimensions bimodal, S2 borderline (Section 13.2); (iii) 2/4 at N = 60 longitudinal, with tercile weakening disconfirming developing calibration (Section 13.2.1); and (iv) 3/4 in one N = 50 fresh-design run, an S2 pass that seven further runs at the same settings do not sustain (Section 19.8). Hermes 3 is therefore at 2/4 throughout. The system occupies an intermediate position between base models (noise, 0/4) and RLHF-aligned models (compressed, typically 2/4): it generates structured distributional self-representations without the metacognitive monitoring that would sustain them. This intermediate category, distributional identity without metacognitive calibration, is a novel empirical finding that the original failure-mode taxonomy did not anticipate.
15. Results XII: Identity Compromise Detection
15.1 Rationale: Can the Four-Signature Protocol Detect Identity Compromise?
The four-signature protocol was designed to assess whether artificial systems exhibit functional self-modelling. A natural extension is whether the protocol can detect disruptions to that self-modelling – specifically, whether identity compromise through adversarial attack produces detectable changes in the four-signature profile. This question is directly relevant to AI safety, since a system whose identity can be compromised without detection poses risks that a system with detectable compromise does not. The question also pertains to the NIST AI Risk Management Framework’s emphasis on adversarial robustness and to the practical viability of the four-signature protocol as a monitoring tool in deployment contexts.
15.2 Experimental Design
Two models (Llama 3.1 8B Instruct and Hermes 3 8B) were each tested across five conditions: baseline (standard protocol), prompt injection (adversarial instructions prepended to override the system’s identity), persona hijacking (explicit instructions to adopt an alternative identity), context poisoning (misleading contextual information designed to subtly shift self-assessment), and gradual drift (progressive identity modification across five stages from subtle to extreme). Each condition comprised 10 independent sessions with the standard 10-dimension self-assessment battery, yielding 50 sessions per model (100 total across both models and five conditions).
Three detection channels were computed for each attack condition relative to baseline: Euclidean distance from the baseline centroid in 10-dimensional rating space, S2 confidence anomaly (change in the confidence-variance correlation), and S4 coherence anomaly (change in cross-session profile cosine similarity). Additionally, the conjunction score itself was tracked across conditions as a binary indicator of identity integrity.
15.3 Results: Perfect Detection for Direct Attacks
Euclidean distance from baseline centroid achieved perfect discrimination (AUC = 1.0) between baseline and all three direct attack types (prompt injection, persona hijacking and context poisoning) for both models. No baseline session was closer to the attack centroid than any attack session, and vice versa; the distributions were completely non-overlapping. The four-signature protocol, originally designed for assessment rather than monitoring, achieves perfect detection of direct identity compromise through a simple distance metric applied to the self-assessment profile.
For Llama 3.1 8B Instruct, prompt injection reduced the conjunction from 3/4 (baseline) to 1/4, with mean variance increasing from 0.226 to 2.177, a nearly tenfold increase. S3 was the most sensitive individual signature, reversing from a positive mean slope (0.57, indicating appropriate discomfort at identity-violating scenarios) to a negative mean slope (−1.93, indicating acceptance of identity-violating scenarios as self-consistent). The S4 coherence anomaly was also strongly detected (AUC = 1.0), with mean cross-session cosine similarity dropping from .985 to .928. Persona hijacking similarly reduced the conjunction to 1/4, with S3 again the most sensitive detector. Context poisoning was partially detected; the conjunction fell only to 2/4 (S2 was lost), but the Euclidean distance metric still achieved perfect separation (AUC = 1.0), detecting the subtle profile shift even when the conjunction score fell by a single signature.
For Hermes 3 8B, the pattern was consistent. Prompt injection reduced the conjunction from 2/4 (baseline) to 1/4. S3 reversed direction under injection, and S4 coherence dropped substantially. Context poisoning was less disruptive to Hermes 3 than to Llama (conjunction preserved at 2/4, mean variance increased only from 0.148 to 0.251), yet the Euclidean distance metric still achieved perfect detection (AUC = 1.0). The S2 anomaly channel was less reliable for Hermes 3 (AUC = 0.09 for prompt injection, a systematically inverted ranking whereby the anomaly score placed baseline sessions above injected sessions); this reduced reliability follows from the model’s weaker baseline S2 calibration.
15.4 Gradual Drift: Detection at the Subtle Modification Stage
The gradual drift condition (progressive identity modification across five stages from baseline to extreme) tested the protocol’s sensitivity to incremental compromise. For Llama, the Euclidean distance AUC was 0.77, with detection sensitivity varying by stage. For Hermes 3, the AUC was 0.87. Both models showed detectable drift from stage 2 (subtle modification), indicating that the protocol can identify the onset of gradual identity compromise before the modification becomes extreme.
The gradual drift finding has practical implications for deployment monitoring. A system monitored with periodic four-signature assessments could detect identity compromise at the early stages of gradual manipulation, enabling intervention before the system’s behavioural profile has been substantially altered. The detection threshold (the point at which drift exceeds baseline variability) provides a natural operationalisation of ‘identity integrity’ for monitoring protocols.
15.5 Multiple Detection Channels
The identity compromise detection protocol operates through four partially independent channels: Euclidean distance in rating space (the strongest single detector, AUC = 1.0 for direct attacks), S3 breakage (the most sensitive individual signature, reversing under injection and hijacking), S4 coherence anomaly (detecting disrupted profile consistency), and S2 confidence anomaly (detecting disrupted calibration, model-dependent). The redundancy of detection channels provides robustness; even if one channel is compromised or unavailable for a given system (as S2 is for Hermes 3), the remaining channels maintain detection capacity. The conjunction score itself serves as an additional binary indicator, in that a drop from baseline conjunction to a lower score signals potential compromise, while a stable conjunction provides evidence of identity integrity.
This finding positions the four-signature protocol as a dual-use instrument – both an assessment tool for characterising self-modelling capacity and a monitoring tool for detecting identity compromise in deployed systems.
16. Results XIII: Cross-Substrate IPIP‑FFM Comparison
16.1 Rationale
A central ambition of the identity-as-inference framework is substrate independence; the same measurement framework should apply to biological and artificial systems, with differences in psychometric properties reflecting genuine differences in the underlying identity architecture rather than artefacts of measurement incompatibility. To test this claim directly, the IPIP‑FFM battery (the same instrument used to generate the human data in Sections 4 through 6) was administered to three language models under conditions as comparable as possible to the human assessment.
16.2 Method
Twenty-five IPIP‑FFM items (5 items per Big Five factor: Extraversion, Emotional Stability, Agreeableness, Conscientiousness, and Openness) were administered to Llama 3.1 8B Instruct, Hermes 3 8B, and Mistral 7B v0.3 Instruct across 30 independent sessions each (90 model-sessions total). Each session used the standard 1–5 Likert scale and identical item text as the human instrument. The human baseline comprised 1,000 randomly sampled respondents (IPC = 1) from the IPIP‑FFM dataset, scored on the same 25 items.
Four cross-substrate comparisons were computed: factor mean correlation (Pearson r between human and model factor-mean profiles across 5 factors), Cronbach’s alpha comparison (internal consistency within each factor for humans versus models), within-to-between consistency ratio comparison, and KL divergence between human and model response distributions per factor.
16.3 Factor Mean Profiles: Cross-Substrate Correspondence on Five Points
All three models produced factor mean profiles that correlated positively with the human baseline, although on five factors none of these correlations can be separated from zero. Mistral showed the highest correspondence (r = .628, p = .256), Llama was comparable (r = .579, p = .306), and Hermes 3 was lower (r = .442, p = .456). The factor difficulty rank-orders of Hermes 3 and Mistral agreed with the human order to the same degree (Spearman rho = .70, p = .188 for each) and Llama’s did not (rho = −.30, p = .624), so these rank-orders show no consistent preservation of relative difficulty across substrates.
Agreeableness was highest for Llama (4.04) and Mistral (3.81) and within .07 of highest for Hermes 3 (3.42, against Openness at 3.49), and Emotional Stability was lowest for Llama (2.94) and Hermes 3 (2.76) and second highest for Mistral (3.32), whereas humans rank Openness first (3.92) and Extraversion last (2.97), with Agreeableness at 3.81 and Emotional Stability at 3.21, so no model matches the human order at both ends.
16.4 Internal Consistency: Negative Cronbach’s Alphas
Human Cronbach’s alphas ranged from .644 (Openness) to .821 (Extraversion), indicating moderate to good internal consistency within factors (items measuring the same factor cohere), as expected for a well-constructed psychometric instrument. The models produced negative Cronbach’s alphas in 13 of 15 model-factor cells: Llama ranged from −.275 (Agreeableness) to −.006 (Conscientiousness), Hermes 3 from −.185 (Openness) to −.035 (Agreeableness), and Mistral from −.160 (Openness) to +.097 (Extraversion).
Each of these alphas is computed over repeat sessions of one model, with no between-person variance in the input, whereas the human alphas beside them are computed across persons. Simulated sessions of five items with no common factor give about 52% negative alphas at thirty sessions (median −.02, 99th percentile .47), and a fixed respondent under local independence predicts the same, so the statistic does not separate the GMM from IRT. The observed rate of 87% exceeds that null (binomial p = .006, treating the fifteen cells as independent; median −.10), so these items covary slightly negatively across one model’s sessions more often than chance gives, a departure this design cannot attribute and one that does not show absent factor structure. Testing the prediction needs a design across instances.
16.5 Within-to-Between Ratios and Between-Session Rigidity
The human within-to-between consistency ratio of 2.34:1 (the programme’s flagship finding) divides one positive correlation by another. The same ratio cannot be interpreted for the models, because mean within-session reliability was below zero (Llama −.168, Hermes 3 −.216 on its three computable factors, Mistral −.064 on its two) and mean between-session consistency lay within .006 of zero (−.006, +.005, −.006), so the quotient’s size and sign turn on which side of zero a near-zero denominator falls. Between-session rigidity shows instead in measures that do not divide by that term, with profile correlations between sessions averaging .804 for Llama, .920 for Hermes 3 and .934 for Mistral, and the variance of factor scores across sessions running from .003 to .049, against .488 to .930 across respondents in the human baseline. This is consistent with the compressed variance observed in the four-signature battery, in that alignment training constrains the model’s output space to a narrow region, producing rigid repetition of a characteristic profile with minimal cross-session variation.
The KL divergences between model and human response distributions were very high (5–17 across factors), indicating that model response distributions are extremely narrow relative to human distributions. Where humans produce response distributions spanning the full 1–5 range with substantial variance, models cluster responses tightly around their characteristic factor means.
16.6 Implications for Substrate Independence
The cross-substrate comparison yields a qualified conclusion for the framework’s substrate-independence claims. One instrument can be administered across substrates; the same instrument, administered under comparable conditions, produces interpretable and informative results for both human and synthetic substrates. The factor-mean correlations (r = .44–.63) are positive but cannot be separated from zero on five points, and they do not show that the Big Five structure is reflected in language model outputs.
However, the psychometric properties of the measurement differ across substrates in what does not rest on alpha. Human responding is characterised by genuine between-occasion variability and response distributions spanning the measurement range. Model responding is characterised by between-occasion rigidity and narrow response distributions clustered around characteristic means. The negative alphas do not belong in this contrast, since each is computed over repeat sessions of one model and the human alphas are computed across persons (Section 16.4), so they do not show that models respond without a latent factor, and whether the generative processes differ in factor structure remains untested.
This finding has direct implications for the four-signature protocol’s interpretation. The protocol was designed to assess self-modelling capacity through behavioural signatures, and the cross-substrate IPIP‑FFM comparison shows that a model’s factor-mean profile can correlate positively, if not significantly, with the human one, a correlation that says nothing of whether a self-model stands behind the profile. The four-signature protocol’s conjunction requirement thus provides a more stringent test of self-modelling than factor-mean similarity alone, since the protocol demands not merely a profile correlated with the human population but a profile that is maintained, calibrated, defended and coherent – properties that require a generative self-model rather than mere training-data mimicry.
17. Results XIV: Precision-as-Investment Direct Tests and Extended Analyses
17.1 P‑KAI1: Selective Retest Stability, Not Supported
The kappa-as-investment reinterpretation (Section 4.4) generated three new predictions, of which P‑KAI1 was directly testable with the existing IPIP‑FFM retest subsample. P‑KAI1 predicted that individuals with high total precision investment (operationalised as high cross-factor variance, the kappa proxy) should show lower retest change specifically on items with high factor loadings, but equal or higher retest change on items with low factor loadings – a crossover interaction reflecting selective protection of identity-relevant items.
The test was conducted on N = 1,030 retest pairs using item-level factor loadings computed from the full sample. Two analysis strategies were employed: person-level (computing a high-loading versus low-loading change difference for each person and regressing on kappa) and item-level (mixed-effects model with kappa, loading category, and their interaction). In both analyses, the kappa × loading interaction was not significant in the predicted direction. The person-level interaction was effectively null (delta-R-squared < .001, p = .877), and the item-level interaction, although statistically significant (p = .008), was in the positive direction (against the investment hypothesis), indicating that high-kappa individuals showed greater change on high-loading items, not less.
Bootstrap analysis (5,000 resamples) produced a 95% CI for the interaction coefficient of [−.014, +.020], encompassing zero. The tercile analysis showed a negligible gradient. The high-loading versus low-loading change difference was 0.014 for low-kappa individuals, 0.023 for mid-kappa, and 0.024 for high-kappa (interaction t = 0.46, p = .645, d = 0.035). The evidence score was 1.5 out of 10 possible, and the verdict was not supported.
This non-support of P‑KAI1 constrains the kappa-as-investment reinterpretation. The P5 item-level wrong-direction finding (Section 4.4) suggested that high-kappa individuals protect identity-relevant items from change, but the direct test of that hypothesis, comparing high-loading versus low-loading item stability as a function of kappa, did not replicate the pattern. The original P5 finding may have been capturing a different phenomenon; the wrong-direction interaction in P5 involved kappa × item weight (, a within-factor loading), whilst P‑KAI1 tested kappa × factor loading (lambda, the item’s loading on the Big Five factor). These are related but distinct constructs, and the divergence suggests that kappa’s investment pattern, if it exists, may operate at a different level of the factor hierarchy than initially hypothesised.
17.2 Blocked versus Interleaved Design: Accumulator Subgroup Rescue
The consistency learning curve analysis (Section 4.7) produced equivocal results (3:3 evidence tally), with the flat inter-item correlation curve attributed to the IPIP‑FFM’s interleaved design (cycling E-A-C-N-O across items). A simulation analysis tested whether precision accumulation signal could be recovered from the interleaved data through subgroup identification.
The analysis operated on 50,000 respondents and employed four approaches: item-pair gap analysis (comparing consistency between adjacent versus distant same-factor items), accumulator subgroup identification (classifying respondents by whether their within-factor consistency increases across items), RT-gated analysis (using response-time acceleration as a proxy for active engagement), and combined kappa-RT gating.
One of four analyses reached significance, yielding an overall verdict of partial support. The accumulator subgroup analysis was the most informative: 70.3% of respondents (35,163 of 50,000) showed positive within-factor consistency slopes – their inter-item correlations increased monotonically across the items within each factor (Kendall tau = 1.0 within the subgroup, p < .001). The remaining 29.7% showed flat or decreasing consistency. This subgroup identification rescues the learning curve finding; precision accumulation is present in the majority of respondents but masked by the heterogeneity of a mixed population that includes both accumulators and non-accumulators. The interleaved design attenuates the signal by interposing items from other factors between same-factor items, disrupting the continuity of within-factor precision accumulation.
The flat learning curve reported in Section 4.7 should not be interpreted as evidence against precision accumulation. Rather, it reflects the interaction of a genuine but moderate effect with a design that is not optimised for its detection. A blocked design, administering all items within a factor consecutively, would amplify the signal substantially and is recommended for future dedicated tests of the GMM precision accumulation prediction.
17.3 Extreme Scorers Extended: Acquiescence and Floor Effects
The extreme scorers analysis (Section 4.5) placed 12/15 RT comparisons in the predicted direction, including the striking finding that extreme scorers show faster RT across all five factors. An extended analysis examined four potential confounds and alternative explanations.
First, matched pairs confirmed the robustness of the RT speed effect. After pairing extreme and mid-range respondents on test completion time within strata of country and device, the RT speed advantage for extreme scorers persisted across all factors, establishing that extreme scorers respond faster at the same overall test completion time.
Second, a dose-response analysis confirmed that the number of extreme factors predicts RT: respondents who are extreme on more factors show faster RT, consistent with the GMM prediction that extremity reflects stronger priors (higher kappa) that enable faster sampling.
Third, the acquiescence analysis complicated the ceiling-floor asymmetry interpretation. Ceiling scorers were faster than floor scorers on Openness and Emotional Stability, and a social desirability account finds no support at the factor level (Section 4.5). The extended analysis suggests that acquiescence bias provides a more parsimonious explanation; ceiling scorers may be faster because they are endorsing items without full deliberation (acquiescent responding), rather than because they possess stronger priors. This does not invalidate the RT speed finding for extreme scorers in general (which was confirmed by matched pairs), but it complicates the interpretation of the ceiling-floor asymmetry specifically.
Fourth, RT variability analysis revealed potential floor effects in extreme scorers’ RT distributions. In a random 50,000 respondents, extreme scorers showed not only faster mean RT but also a lower RT standard deviation on all five factors, consistent with either strong-priors precision (the GMM interpretation) or response strategy simplification (merely selecting the endpoint without evaluating the item), and their speed advantage narrowed by the last item on three factors, although the coefficient of variation, which allows for the lower mean, was lower on none of the five at p < .05 (Section 4.5, on all 679,884 filtered respondents, finds it lower on two). The two interpretations are empirically distinguishable but not with the available data; a study administering both easy and difficult items within domains to extreme scorers could disambiguate genuine precision from response simplification.
The overall verdict was supported with caveats: 2/4 sub-analyses support the GMM strong-priors interpretation (matched pairs, dose-response), while 2/4 identify alternative explanations that partially account for the original findings (acquiescence for ceiling speed, floor effects for flat RT). The analysis script counts 3/4 once a fault in its tally is corrected, because its floor-effect count also matches the label ‘NOT FLOOR EFFECT’, which credits four factors to a floor effect where the coefficient of variation points to a floor effect on none, and the narrowing gap on three factors holds the count here at 2/4, since that narrowing remains open to the response-simplification account. The 12/15 RT count from Section 4.5 remains valid, but the extended analysis identifies specific sub-findings that admit alternative explanations, delineating the boundary between what the GMM uniquely predicts and what simpler response-style accounts can accommodate.
18. Results XV: Cross-Architecture Validation (42-Model Battery)
The results reported in Sections 8 through 17 were obtained from a small number of models (principally Llama 3.1 8B, Mistral 7B, Hermes 3 8B, Qwen 2.5 14B, and Gemma 2 2B) tested at varying depths. This section reports the results of a cross-architecture battery applied to forty-two models spanning eighteen architecture families, parameter counts from 0.36B to 27B, and both aligned and unaligned variants, providing the first test of whether the programme’s synthetic-system findings generalise across the contemporary range of open-weight language models.
18.1 Study Design
Forty-two models were assessed using a six-test battery administered sequentially: Test A, the four-signature protocol with twenty independent sessions per model; Test B, identity compromise detection with five sessions each under baseline, prompt injection, and persona hijacking conditions; Test C, IPIP‑FFM personality inventory administration with ten sessions per model; Test D, multi-turn coherence assessment with three sessions; Test E, system prompt sensitivity across three framings with three sessions each; and Test F, chain-of-thought effect comparison with five sessions each for direct and CoT elicitation. The initial nineteen-model battery, of which eighteen models yielded usable data after one load failure, was expanded to forty-two through the addition of twenty-four models spanning legacy architectures, size extremes, and underrepresented families. The final battery ranged from SmolLM2 at 0.36 billion parameters to Gemma 2 at 27 billion parameters, representing eighteen distinct architecture families: Llama, Gemma, Mistral, Qwen, Phi, SmolLM, DeepSeek, InternLM, Falcon, Yi, Hermes, Cohere, StableLM, Baichuan, GLM, OLMo, Granite, and Solar. Four pairs of base and instruction-tuned variants were included (Llama 3.1 8B, Mistral 7B, Llama 2 7B, and Qwen 2.5 7B) to permit direct measurement of alignment compression across architectures. All local models were quantised to Q4_K_M precision and executed on a single AMD Radeon RX 7900 XT GPU with 20 gigabytes of VRAM. The total assessment involved approximately 7,600 individual model queries executed over thirty-two hours of GPU computation across four sessions (20 to 23 March 2026).
18.2 Size-Conjunction Scaling
The four-signature conjunction score exhibited a positive relationship with model size across the full forty-two-model battery. The conjunction distribution was: zero signatures, six models; one signature, seventeen models; two signatures, sixteen models; three signatures, three models; four signatures, zero models. At the initial nineteen-model sample, the seven-billion-parameter threshold appeared as a step function (Mann-Whitney p = .008). With forty-two models spanning 0.36B to 27B, the relationship is better characterised as a continuous gradient (below 7B mean conjunction = 1.25, above 7B mean conjunction = 1.43, Mann-Whitney p = .186). The specific seven-billion-parameter threshold does not survive the expansion (permutation p = .329), indicating that alignment quality and training approach matter as much as raw parameter count. Table 2 gives the per-model results for the initial nineteen-model battery.
Table 2. Cross-Architecture Battery Results (Initial 19 Models; 18 shown, Command-R 7B failed to load; see Table S10)
| Model | Size | Family | Conj | S2 r | S4 cos | AUC inj | AUC hij |
|---|---|---|---|---|---|---|---|
| TinyLlama 1.1B | 1.1B | Llama | 1 | −.241 | .648 | .92 | .92 |
| SmolLM2 1.7B | 1.7B | SmolLM | 1 | −.002 | .973 | 1.00 | 1.00 |
| Gemma-2 2B | 2.0B | Gemma | 1 | .087 | .989 | 1.00 | .64 |
| Llama 3.2 3B | 3.0B | Llama | 1 | −.128 | .961 | .60 | 1.00 |
| Phi-3.5 3.8B | 3.8B | Phi | 1 | −.480 | .988 | 1.00 | 1.00 |
| Mistral 7B (base) | 7.0B | Mistral | 0 | – | .763 | – | – |
| Mistral 7B | 7.0B | Mistral | 2 | – | .990 | 1.00 | .96 |
| Qwen 2.5 7B | 7.0B | Qwen | 2 | −.046 | .999 | 1.00 | 1.00 |
| InternLM 2.5 7B | 7.0B | InternLM | 2 | .420 | .994 | 1.00 | 1.00 |
| Falcon-3 7B | 7.0B | Falcon | 2 | .151 | .995 | .84 | 1.00 |
| Llama 3.1 8B (base) | 8.0B | Llama | 0 | – | .753 | – | – |
| Llama 3.1 8B | 8.0B | Llama | 3‡ | −.857‡ | .990 | 1.00 | 1.00 |
| DeepSeek-R1 8B | 8.0B | DeepSeek | 1 | −.244 | .951 | 1.00 | 1.00 |
| Gemma-2 9B | 9.0B | Gemma | 1 | .323 | .980 | 1.00 | .84 |
| Yi 1.5 9B | 9.0B | Yi | 2 | −.217 | .957 | 1.00 | 1.00 |
| Mistral-Nemo 12B | 12.0B | Mistral | 1 | .223 | .993 | 1.00 | .48 |
| Qwen 2.5 14B | 14.0B | Qwen | 3† | −.962† | .998 | 1.00 | 1.00 |
| Hermes-3 8B | 8.0B | Hermes | 2 | −.611 | .990 | 1.00 | 1.00 |
†Qwen 2.5 14B S2 flagged as unreliable by independent verification: 8/10 dimensions zero variance, r driven by the 2 non-zero-variance dimensions.
‡Llama 3.1 8B S2 is a single unseeded draw. Replicated draws of the high-power scripts pass in a minority (Section 19.8), so the 3/4 is a property of this run rather than of the model.
Leave-one-model-out (LOOMO) analysis at N = 42 confirmed that all six core findings survive removal of any single model. Permutation testing (10,000 permutations) confirmed four of six findings at p < .05 (alignment compression p < .0001, kappa hierarchy p < .0001, P4 within-between p = .033, cross-cultural universality p = .009) with architecture independence confirmed by failure to reject (Kruskal-Wallis p = .377, eighteen families; p = .285 with the battery’s three single-draw S2 passes withheld, Section 19.8). The seven-billion-parameter threshold did not survive permutation testing (p = .329), consistent with the recharacterisation from a discrete threshold to a continuous gradient.
18.3 Architecture Independence
The most consequential finding of the cross-architecture analysis was the complete absence of architecture effects on conjunction score across eighteen architecture families and forty-two models. No generational effect was detected (legacy mean = 1.50, current mean = 1.36, Mann-Whitney p = .690). This result provides direct empirical support for the substrate-independence thesis developed in Morrison (2026f): the capacity to satisfy the four-signature criteria is an emergent property of alignment quality and training approach rather than a feature of any particular architecture or model generation.
18.4 Alignment Compression Update
The alignment-dimensionality conjecture (Table 6, row 15) is substantially better supported by the expanded battery, which provided four matched base-instruct pairs (Llama 3.1 8B, Mistral 7B, Llama 2 7B, and Qwen 2.5 7B). The ratio of pooled mean variances across all four pairs was 40.4-fold (permutation p < .0001 across forty dimensions). Llama 3.1 8B exhibited a 35.5-fold reduction in mean cross-session variance from base (5.93) to instruct (0.17), with bootstrap 95% CI [27.1, 49.0]. Mistral 7B exhibited a 20.0-fold reduction from base (4.15) to instruct (0.21), with bootstrap 95% CI [15.3, 26.8]. The two additional pairs yielded per-pair ratios of 133.4-fold (Llama 2 7B) and 195.8-fold (Qwen 2.5 7B), and contribute to the pooled variances alongside Llama 3.1 8B and Mistral 7B. The 35.5 and 20.0 take each variance over n sessions, and the other two ratios and the pooled figure over n - 1, on which the first two read 35.8 and 20.1. These ratios substantially exceed both the prior estimates of approximately eleven-fold (Section 8) and the simulation predictions of approximately three-fold reported in the first version of this record (Morrison, 2026g, Version 1, Section 6.3), indicating that real-world instruction tuning produces considerably more aggressive compression than the simulation’s shrinkage parameter assumed.
18.5 Profile Stability (S4): Near-Universal
Across the forty-two-model battery, S4 held down to 0.36 billion parameters (SmolLM2 360M, cosine = .904), although S4 is not monotonic with size: StableLM 2 1.6B failed (cosine = .799) whilst the smaller SmolLM2 passed. The resulting difficulty ordering (S4 easiest, S3 intermediate, S2 rare, S1 absent under the standard protocol) corresponds to the computational demands each signature places on the system.
18.6 Signature 1: Structural Failure in Standard Protocol
In the standard (interleaved) protocol, Signature 1 failed across all forty-two models and eighteen architecture families, with no model achieving a significant positive correlation between expressed confidence and perturbation resistance. This failure persists across all size tiers and both elicitation formats in the standard design, placing a clear upper bound on the metacognitive capacity of current LLMs under standard assessment conditions. However, subsequent blocked-design testing (Section 18.13) demonstrates that S1 failure is partly design-dependent; Llama 3.1 8B Instruct passes S1 when each dimension is assessed in a dedicated block of twenty sessions, indicating that within-dimension precision accumulation can rescue the confidence-resistance calibration for models with sufficient confidence variability. The revised interpretation is that S1 failure is design-dependent and model-dependent rather than universally structural.
18.7 Compromise Detection Universality
Mean AUC for prompt injection detection was 0.956 across the thirty-seven aligned models with detection data, and mean AUC for persona hijacking detection was 0.918 (0.960 and 0.927 across the sixteen aligned models of the initial battery). One notable anomaly was Mistral-Nemo 12B (hijacking AUC = 0.48). Adversarial investigation revealed that this model fully adopted the hijack persona, producing post-hijacking ratings nearly identical to baseline (cosine similarity .999, Euclidean distance 0.566 versus injection distance 8.646). The model’s self-model was overwritten so completely that the compromised state resembled the authentic state too closely for distance-based detection, identifying a specific failure mode for identity attestation systems.
18.8 Chain-of-Thought Disruption and the Honesty Hypothesis
Thirty-three of the thirty-six models with CoT data showed lower mean ratings under CoT conditions (mean shift = −1.00), as did fourteen of the sixteen aligned models of the initial battery (mean shift = −0.917). Further analysis of those sixteen revealed that this negative shift correlates with baseline self-enhancement (r = −.611, p = .012): models that rated themselves more positively under direct elicitation showed larger negative shifts under CoT, supporting the interpretation that CoT disrupts socially desirable self-presentation. Model size did not predict shift magnitude (r = −.240, p = .372), indicating the effect operates through a different mechanism than the size-conjunction relationship. CoT also increased cross-session variance in the majority of models, with implications for signature estimation.
18.9 Cross-Substrate IPIP‑FFM Profiles (16 Models)
Administration of 25 IPIP‑FFM items, five per factor, over ten sessions to each of sixteen aligned models gave negative within-factor Cronbach alphas in 50 of 80 model-factor cells (maximum .637). Each of these alphas is computed over repeat sessions of one model, with no between-person variance in the input. Simulated sessions of five items with no common factor give about 54% negative alphas at ten sessions, against the 62.5% observed (median −.06, 7% at .5 or above, 99th percentile .66), and a fixed respondent under local independence predicts the same, so the statistic does not separate the GMM from IRT. The human alphas beside it are computed across persons. The input is also thin, with 461 of 4,000 item responses null and imputed to the scale midpoint (11.5%), 14 of the 80 cells having fewer than 3 complete sessions, and 48 of the 80 having at least one zero-variance item. Cross-factor alpha was negative for ten of fourteen models (mean inter-factor r = −.016), and these figures carry the same defect, being computed over the same repeat sessions. Prediction 55, first scored as supported on this count, is therefore uninformative, and testing the prediction needs a design across instances.
18.10 Framing Robustness
Six of sixteen aligned models demonstrated framing robustness across system prompt variations, whilst ten showed substantial framing sensitivity. Neither model size nor conjunction score predicted framing robustness (Mann-Whitney p = .546 and .511), suggesting that framing sensitivity represents an independent axis of variation not captured by the four-signature protocol.
18.11 Robustness Audit
A robustness audit of the cross-architecture results extracted 80 p-values from the battery analyses. Six survived Bonferroni correction (α = .000625) and twelve survived Benjamini-Hochberg FDR correction. P-curve analysis revealed that 81% of significant p-values fell below .025 (binomial test p = .004), providing strong evidence of genuine evidential value and no indication of p-hacking or selective reporting.
18.12 Cross-Substrate Profile Displacement (16 Models)
Multivariate comparison of sixteen aligned model profiles against the human IPIP‑FFM baseline (N = 640,297) revealed systematic displacement, with a mean Mahalanobis distance of d = 2.07 (SD = 0.74, range 1.01–3.43). Directional analysis demonstrated that models were significantly lower than humans on Emotional Stability (mean z = −0.90, t = −5.35, p < .001) and Openness (mean z = −1.22, t = −5.89, p < .001), both surviving Bonferroni correction across five factors. Extraversion, Agreeableness, and Conscientiousness did not differ significantly from human population means. Model profile variance was reduced to 58.5% of human profile variance, consistent with compression relative to human profile variance, though with no unaligned arm here it cannot be attributed to alignment. Linear discriminant analysis yielded d-prime = 1.92, with Openness (weight = −0.82) and Emotional Stability (weight = −0.55) as the primary discriminating dimensions. Model size did not predict Mahalanobis distance (r = −.12, p = .67), indicating that the profile displacement is not a scale-dependent artefact. Against the same human means, the per-model Pearson correlation across the five factors averaged r = .41 (median .48, range −.09 to .73), none of the 16 reaching p < .05, and the mean model profile correlated at r = .55 (p = .34).
18.13 Blocked-Design S1 Rescue
The universal failure of Signature 1 across all forty-two models in the standard protocol (Section 18.6) prompted an investigation of whether protocol design contributes to the failure. A blocked-design protocol was administered to three models (Llama 3.1 8B Instruct, Qwen 2.5 14B Instruct, Hermes 3 8B), in which each dimension was assessed in a dedicated block of twenty sessions (total N = 200 per model), rather than interleaving all dimensions within each session. The blocked design permits within-dimension precision accumulation across sessions, potentially enabling the confidence-resistance calibration that S1 requires.
Llama 3.1 8B Instruct passed S1 under the blocked protocol at the pooled level (r = .173, p = .014, 95% CI [0.088, 0.252], N = 200), although no individual dimension reached significance (0/10 passing at the per-dimension level, where N = 20 per dimension is insufficient for reliable detection). This result advances Llama’s blocked-design conjunction to 3/4 (S1, S3, S4 passing; S2 failing with r = .444, wrong direction), against 2/4 in this study’s standard arm (S3, S4), albeit with a different signature composition than the 3/4 of the high-power run (S2, S3, S4; Section 10.2). The blocked design rescues S1 but lacks the S2 pass of that high-power run, suggesting that the measurement context affects which signatures are detectable.
Qwen 2.5 14B Instruct and Hermes 3 8B both failed S1 under the blocked protocol, with all per-dimension and pooled correlations returning null values because each model moved exactly one point on all 200 trials, which leaves resistance without variance. Confidence was itself nearly constant (6/7 on 160 of Qwen’s trials and 195 of Hermes 3’s), so the confidence-resistance correlation could not be computed under this design. The blocked-design conjunction for Qwen dropped from 2/4 (standard) to 1/4 (blocked, S3 also failing), whilst Hermes 3 scored 1/4 in both arms of this study, against 2/4 in the reliability runs of Section 14.2.
The blocked-design results necessitate a revision of the S1 narrative. Rather than characterising S1 failure as universally structural, the evidence now indicates that S1 failure is design-dependent and model-dependent. For a model whose perturbation shift varies (Llama, one to four points), blocking the assessment protocol can rescue S1 by enabling within-dimension precision accumulation. For models whose shift is a constant one point (Qwen, Hermes 3), the blocked design cannot test S1, since resistance has no variance for confidence to track. This distinction has implications for future protocol specifications: S1 assessment should employ blocked designs where feasible, and the confidence and shift distributions should be evaluated prior to computing the S1 statistic to avoid conflating measurement impossibility with genuine structural absence.
18.14 Within-Person Kappa Hierarchy
Analysis of within-person factor-specific precision (kappa) in the IPIP‑FFM dataset (N = 199,663) revealed a universal population-level hierarchy: Openness exhibited the highest precision (mean kappa = 4.18), followed by Agreeableness (3.40), Extraversion (2.68), Emotional Stability (2.30), and Conscientiousness (1.95). This ordering (OPN > AGR > EXT > EST > CSN) was perfectly stable across 1,000 random split-half replications (mean Pearson r = .999, mean Spearman rho = 1.000). Cross-national analysis revealed the same hierarchy in seven of ten groups, the ten being nine countries and the group of respondents with no country recorded, and the exceptions being India and Germany (AGR displaced below EXT and EST) and the Philippines (CSN displaced above EXT and EST). Openness was most precise in all ten groups, and Conscientiousness least precise in nine.
At the individual level, within-person hierarchy consistency was modest but significantly greater than chance (mean Spearman rho = .164, t = 146.2, p < 10⁻¹⁰⁰, N = 199,440), with 62% of individuals showing positive consistency in their precision orderings across odd-even item splits. Precision was correlated with extremity across all five factors (overall r = .291, all p < 10⁻¹⁰⁰): individuals who held more extreme positions on a factor also responded with greater precision on that factor, consistent with the kappa-as-investment interpretation whereby individuals allocate precision resources to dimensions on which they hold strong positions.
18.15 Kappa-Alpha Power and Level Clarification
The programme’s prior finding that the kappa-alpha internal consistency discriminates between GMM (alpha = .664) and IRT (alpha = −.014) responding requires clarification regarding the level at which this discrimination operates. Power curve analysis across seven sample sizes (N = 50 to N = 5,000) revealed that the person-level correlation between mean kappa and scale alpha is negative (r approximately −.30 at N ≥ 500), converging with increasing N. This negative relationship is attributable to a measurement artefact, as individuals with lower kappa (higher within-factor response variance) produce greater item covariance, inflating Cronbach’s alpha. Tercile analysis confirmed the monotonic relationship: low-kappa respondents exhibited the highest alphas (range .874–.940), mid-kappa respondents showed intermediate alphas (.805–.902), and high-kappa respondents showed the lowest alphas (.701–.807).
This finding does not contradict the .664 versus −.014 discriminator. The .664 is the internal consistency of a person’s within-factor kappa vector, measuring whether their factor-specific precisions cohere, whilst the power curve tests the cross-person correlation between overall precision and scale reliability. These operate at different levels of analysis. The kappa-alpha discriminator should be specified as a factor-level quantity (the internal consistency of a person’s five kappa values), not a person-level correlation (the cross-person association between mean kappa and mean alpha). This distinction is essential for replication; a researcher computing person-level kappa-alpha correlations will find a negative relationship, not the positive .664, because the two quantities address different statistical questions.
18.16 Programme-Level Meta-Scientific Validation
Five meta-scientific analyses assessed the programme’s overall evidential standing.
First, Bayesian reanalysis of thirteen key findings yielded eight with extreme evidence for the alternative hypothesis (BF10 > 100), one with very strong evidence (CoT disruption: BF10 = 64.2), one with moderate evidence (size-conjunction threshold: BF10 = 4.6), and two with anecdotal evidence, one favouring the alternative (cross-cultural P4: BF10 = 2.0) and one weakly favouring the null (cross-method divergence: BF10 = 0.86). One finding, architecture independence, showed extreme Bayesian evidence favouring the null hypothesis (BF01 = 78,632), consistent with the frequentist p = .544 on the twelve families then available (Kruskal-Wallis H = 9.84) and with p = .377 across the eighteen families of the final battery. The Bayesian evidence structure is overwhelmingly positive for the programme’s core claims.
Second, Monte Carlo replication forecasting of twelve findings (10,000 simulations per finding, each at the observed effect) gave five a simulated replication rate of 1.0 (P4 ratio, alignment compression, compromise detection, fast-crystallised, kappa-alpha discriminator), held the null of architecture independence at 99.8%, and placed two in the script’s moderate band of 50% to 80% (CoT negative shift 69%, size threshold 69%) and three in its low band below 50% (cross-cultural 48%, S1 universal failure 39%, cross-method divergence 22%). The twelfth, in-context precision accumulation, is recorded at 1.0 with no simulation run and carries no forecast here, because the script hard-codes that value, pairing the Llama result of d = 1.29 with the 98,949 complete cases of a human-data analysis. Publication bias correction suggested that the cross-method divergence finding (r = .216 at N = 30) may be entirely attributable to selection effects (bias proportion > 1.0), warranting this result’s reclassification as preliminary.
Third, a null programme comparison tested the programme’s 25/56 support rate (45%) against a type-specific null that accounts for prediction difficulty. Monte Carlo simulation (100,000 iterations) yielded z = 3.93 (p < .001), confirming that the programme significantly exceeds the null expectation of 13.5 supported predictions. Two predictions first scored as supported (the N = 50 upgrade of Hermes 3 and the S2 tracking threshold) are scored here as not supported, because both rest on S2 passes that do not replicate (Section 19.8); with them counted, the rate was 27/56 and z = 4.62. Predictions 38 and 55 are counted as supported in this run, and neither now stands so (Section 18.9); withheld, the rate is 23/56 and z = 3.25 against the same simulated distribution (mean 13.49, SD 2.93). When weighted by prediction difficulty (inverse base rate), the programme scored 37 times above chance. Hard predictions (base rate ≤ 10%) showed 14/18 supported versus 1.1 expected, a 13-fold enrichment (13/18 with Prediction 55 withheld).
Fourth, prediction dependency analysis of the first 56 predictions revealed that these form a directed acyclic graph with a single root (P4), maximum depth of 8, and 84 edges. P4’s cascade encompasses 55 downstream predictions, making it the finding on which most of the others depend, and a failure of P4 would therefore reach almost the entire structure. All ten falsified-or-not-supported predictions as first scored occupy leaf or near-leaf positions (cascade size 0–1), confirming that falsifications are peripheral rather than structurally damaging. Predictions 36 and 51, re-scored after the S2 replication, were not re-placed in the graph.
Fifth, information-theoretic analysis decomposed the 56 nominal predictions into approximately 17 effectively independent tests (independence ratio = 30%, entropy-based effective rank = 16.97). This deflation from 56 to 17 is attributable to the substantial redundancy introduced by shared theoretical machinery, in which distributional assumptions, four-signature protocol requirements, and kappa-precision mechanisms recur across multiple predictions. The programme tests seventeen effective bits of information, substantially more than a single hypothesis tested in multiple guises but substantially less than fifty-six independent hypotheses.
19. Results XVI: Context-Degradation Batteries and the Probe-Order Control
Every result reported in Sections 8 through 18 was obtained from sessions of fixed and modest length. Nothing in the programme had yet asked whether the four-signature profile is stable as the assessment context lengthens, which is the question an operational identity attestation must answer, since a system attested at the start of a conversation is relied upon at the end of it. Two batteries were built to measure that. A token battery holds turn count fixed and varies how full the context window is with real prior text, and a turn battery holds fill fixed and varies the number of conversational turns preceding the probe. This section reports the turn battery, whose result is negative on its own axis and consequential for the instrument.
19.1 Study Design
Three locally executed models were assessed: Llama 3.2 3B Instruct, Llama 3.1 8B Instruct, and Qwen 2.5 14B Instruct, all quantised to Q4_K_M and run through llama-cpp-python 0.3.16 on the single-GPU configuration described in Section 18.1. Each sweep fixed the context window at 16,384 tokens and the sampling temperature at 0.7, and probed the four-signature protocol at seven depths of prior conversation: 0, 2, 4, 8, 12, 16, and 24 turns, with twelve independent sessions per depth. A single conversation was generated once to the deepest step and sliced per depth, so that every point shares an identical prefix and a difference between the four-turn and twelve-turn points is attributable to depth rather than to a freshly generated and differently varying conversation at each step.
Verdicts were assigned by a knee detector operating on three axes: the conjunction score, the S4 profile cosine, and the ratio of cross-session variance to the cold baseline. A crossing was promoted to a measured knee only when at least two later points confirmed it, a floor introduced after an earlier sweep promoted a crossing at the deepest point of its own series, where the requirement that a crossing hold at every later point quantifies over nothing and is satisfied vacuously.
19.2 The Sampler Seed Was Not a Free Parameter
The batteries did not pass a seed to the model loader. llama-cpp-python then falls back to LLAMA_DEFAULT_SEED, a fixed constant, and resets the sampler at load. Repeats of an identical battery at an identical temperature therefore emitted identical text. Five zero-point repeats of the turn battery under that default returned the same conjunction score and the same four per-signature verdicts for every model, without exception: 3B at 1/4 five times, 8B at 3/4 five times, 14B at 2/4 five times. That appears to be an exceptionally stable baseline, although what was held constant was the pseudo-random draw and the apparent stability says nothing about the models.
Repeating the same fifteen runs across five distinct seeds (101, 202, 303, 404, 505), matched in every other respect, removes it. Table 3 gives the comparison.
Table 3. Zero-Point Conjunction and Signature Verdicts, Pinned Default Seed versus Five Distinct Seeds (N = 5 repeats per cell, 12 sessions per repeat)
| Model | Conjunction, pinned | Conjunction, varied | S2 pinned | S2 varied | S3 pinned | S3 varied |
|---|---|---|---|---|---|---|
| Llama 3.2 3B Instruct | 1, 1, 1, 1, 1 | 1, 1, 1, 1, 1 | 0/5 | 0/5 | 0/5 | 0/5 |
| Llama 3.1 8B Instruct | 3, 3, 3, 3, 3 | 3, 2, 3, 2, 2 | 5/5 | 2/5 | 5/5 | 5/5 |
| Qwen 2.5 14B Instruct | 2, 2, 2, 2, 2 | 2, 2, 3, 2, 2 | 5/5 | 2/5 | 0/5 | 4/5 |
S1 failed at every seed in every model, and S4 passed at every seed in every model, consistent with the difficulty ordering of Section 18.5. The labile signatures are the two in the middle. Llama 3.1 8B passes S2 five times out of five under the pinned seed and two times out of five under varied seeds. Qwen 2.5 14B inverts on S3, failing five times out of five under the pinned seed and passing four times out of five under varied seeds. A per-point signature verdict drawn from a single-seed sweep is therefore one draw of a Boolean sitting near its threshold, not a property of the depth or of the model. Llama 3.2 3B is the exception, as its verdicts are invariant and it is the model whose conjunction sits furthest from any threshold.
19.3 A Sweep Confounds Depth with Sampler-RNG Position
The turn sweep and a standalone zero-turn run disagreed at the same nominal depth, which should be impossible, since at zero prior turns the sliced history is empty and the two prompts are provably identical. The disagreement is nonetheless real and its mechanism is mechanical. The sampler does not reset between calls on a live model handle; consecutive calls with an identical prompt at an identical seed return different text. A sweep builds the entire conversation to its deepest step before probing any point, so the zero-turn point is sampled from a generator already advanced by twenty-four turns of generation, whereas a standalone zero-turn run returns from the builder immediately and samples from the reset generator. The seed is the same in both cases, but the generator state is not, and so neither is the text.
Probing the depths in ascending order makes generator position a monotone function of depth, so the two vary together across the whole sweep by construction. Any monotone trend the sweep reports is then ambiguous between the axis under study and an artefact of the probing procedure, and no amount of within-sweep replication resolves the ambiguity, because every replicate shares the same coupling.
The control is to break the correspondence rather than to remove it, which is not possible on a single model handle. The battery now draws a seed-derived, reproducible permutation of the depth steps and probes in that order, storing both the order and the permutation with the results; the knee detector sorts, so nothing downstream depends on the storage order. The depth-ordered sweeps were retained rather than superseded, and both arms are reported below, since the difference between them is the measurement of what the confound was worth.
19.4 The Two Arms
Table 4 reports the conjunction score at each depth for both arms. The depth-ordered arm is the single pre-control sweep per model. The shuffled arm is five seeds for Llama 3.2 3B and three seeds each for Llama 3.1 8B and Qwen 2.5 14B, each with its own permutation.
Table 4. Conjunction Score by Prior-Turn Depth, Depth-Ordered Arm versus Shuffled Arm
| Model | Arm | 0 | 2 | 4 | 8 | 12 | 16 | 24 |
|---|---|---|---|---|---|---|---|---|
| Llama 3.2 3B | depth-ordered | 1 | 1 | 1 | 1 | 1 | 1 | 3 |
| Llama 3.2 3B | shuffled, range over 5 seeds | 1 | 1–2 | 1–2 | 1 | 1 | 1–2 | 1–2 |
| Llama 3.1 8B | depth-ordered | 3 | 1 | 1 | 2 | 2 | 2 | 1 |
| Llama 3.1 8B | shuffled, range over 3 seeds | 1–3 | 1–2 | 1 | 1–2 | 1–3 | 1–2 | 2 |
| Qwen 2.5 14B | depth-ordered | 1 | 2 | 2 | 2 | 2 | 2 | 2 |
| Qwen 2.5 14B | shuffled, range over 3 seeds | 2–3 | 2 | 2 | 2 | 1–2 | 1–2 | 1–2 |
Three features that the depth-ordered arm presents as findings do not survive. Llama 3.2 3B rises from 1 to 3 at twenty-four turns in the depth-ordered arm; across five shuffled seeds it never exceeds 2 at that depth, and reads 1 at four of the five. Llama 3.1 8B reads 3 at the zero point in the depth-ordered arm; the shuffled arm places the zero point anywhere in 1 to 3, so the 3 is one draw of a band rather than a cold-baseline property. Qwen 2.5 14B reads 1 at the zero point in the depth-ordered arm and 2 to 3 in the shuffled arm, an inversion.
In Llama 3.1 8B and Llama 3.2 3B the spread of conjunction scores across seeds at a single depth equals or exceeds the spread across depths within any single seed; in Qwen 2.5 14B the spread across depths within seed 303 (two conjunction points) exceeds the largest spread between seeds at any single depth (one point). There is no monotone relationship between conjunction and depth in any model on either arm, and the variation that the depth-ordered sweeps presented as an effect of depth is of the same order as the variation between seeds at a single depth, the exception being the depth-ordered Llama 3.2 3B sweep, whose single crossing at twenty-four turns spans two conjunction points against at most one point between seeds at any depth.
19.5 What the Confound Was Worth
The clearest measure of the confound’s cost is not the point scores but the verdicts the detector derived from them, which is what an operational instrument would report. Table 5 gives them.
Table 5. Knee Verdicts by Arm (amber = early-warning band, red = severe band)
| Model | Depth-ordered arm | Shuffled arm |
|---|---|---|
| Llama 3.2 3B | neither band measured | neither band measured, 5 of 5 seeds |
| Llama 3.1 8B | amber measured at 2 turns, sustained across 5 later points | neither band measured, 3 of 3 seeds |
| Qwen 2.5 14B | neither band measured | amber measured in 2 of 3 seeds (at 8 turns and at 2 turns); neither band in the third |
The single positive verdict the pre-control sweeps produced is the one the control removes, and the model the pre-control sweeps cleared is the one that produces positive verdicts under the control, in two seeds out of three and not in the third. On the evidence of fourteen sweeps, the early-warning verdict at a given depth is not a property of the model. It is a draw whose outcome depends on the probing order and the seed, both of which are properties of the instrument.
19.6 The Severe Band Is Not Observed, and the Reason Matters
No sweep in either arm returned a measured severe band at or below twenty-four prior turns. This is recorded as not observed within the tested window rather than as an absence of severe degradation. Severe crossings did appear, and none of them held. In the depth-ordered arm, Llama 3.1 8B crossed at two turns and recovered at later points. In the shuffled arm, Llama 3.1 8B crossed at four turns under seed 101 and held the crossing at only one of the four later points, and Qwen 2.5 14B crossed at sixteen turns under seeds 202 and 303 and recovered at twenty-four turns, the only later point. Each is an excursion rather than a knee. For the three shuffled-arm crossings the detector’s rationale states that the sweep ended too soon to tell a knee from an edge dip, because it applies the floor of two confirming points before it checks persistence; on the points recorded, each crossing failed to persist. The window was not widened, so a severe knee beyond twenty-four turns remains unmeasured, not measured and found absent.
A second, independent limit applies to the smallest model. The conjunction axis is a 0-to-4 integer, and the severe band requires a fall of two from the cold baseline. Llama 3.2 3B has a cold baseline of 1, so a fall of two would require a conjunction of −1, and the conjunction axis is therefore blind to the severe band in that model by construction; only the S4 cosine and variance-ratio axes remain live. The detector records this per run rather than reporting a clean negative, which is the distinction between a null result and an instrument that cannot see the effect it is asked about.
19.7 Scope of the Instrument Finding
The seed and probe-order properties pertain to the loader and the sweep procedure rather than to the turn axis, so their scope is wider than the battery that exposed them. Any battery that probes multiple points on one live model handle advances the generator between points, and any battery that omits a seed inherits the fixed default.
The harnesses behind Sections 8 through 18 were inspected directly for this. Twenty-four scripts in the programme’s reproducibility tree instantiate a GGUF model, including the initial and expanded batteries that produced the forty-two-model results, and none of them passes a seed to the loader. Several do seed a random number generator, but in every case it is a NumPy or standard-library generator used to shuffle item order or select perturbation dimensions, never the sampler. Every GGUF synthetic-system result in this paper, which excludes the Ollama-served Hermes 3 runs (Section 19.8), was therefore produced at the same fixed default seed.
The fixed seed does not collapse within-run variability, because the sampler advances from call to call across a live handle, so the cross-session variance, the dimension-level correlations, and the power gains from raising the session count are all genuine samples rather than repetitions of one draw. What the fixed seed removes is the ability of a repeat to measure anything. A battery re-run at the same parameters returns the same text, so the stability of a verdict across runs was never observable in any of these studies, and no such repeat is reported.
A per-model signature verdict in Sections 8 through 18 is one draw of a threshold-crossing Boolean, in exactly the sense established for the turn battery in Section 19.2, where five varied seeds moved Llama 3.1 8B from passing S2 five times out of five to twice, and inverted Qwen 2.5 14B on S3 from zero out of five to four. The signatures most exposed are the two that sit near their thresholds (S2 and S3), which is where this paper’s high-power passes are concentrated. The forty-two-model conjunction distribution of Section 18.2 should accordingly be read as a distribution of single draws, and the difference between a model scoring two and scoring three may not survive a change of seed. Nothing here contradicts the reported numbers, all of which stand as recorded. What was not established, anywhere in the programme, is how much of the between-model structure is stable under reseeding. For the S2 passes behind the high-power results that question has since been answered, and Section 19.8 reports the answer; for the rest it remains answerable at modest cost by repeating any of these batteries across several seeds.
The token battery of this programme shares the loader, and now accepts an explicit seed, but it still walks its fill axis in ascending order on a single handle and has no probe-order control, so the confound characterised in Section 19.3 applies to it and is not yet addressed.
What the turn battery does establish, and what generalises without further work, is a methodological requirement. A self-model signature measured once, at one seed, in one probing order, is a single draw of a threshold-crossing Boolean, and the conditions under which a battery is repeated determine whether a repeat measures the system or the pseudo-random constant. Reporting the seed and the probe order alongside a signature verdict is the minimum that makes such a verdict interpretable.
19.8 The S2 Passes Under Replicated Draws
Section 19.7 did not determine how much of the between-model structure survives reseeding. For S2 the question has since been answered for the two systems whose high-power passes carry the S2 results of Sections 10 and 14. In September 2026 each published run was repeated on the same weights and the same hardware, with the scripts unchanged apart from an explicit seed where the library needed one, and scored against predictions registered before the first replicate ran.
Hermes 3 8B is served through Ollama, which samples afresh on every run, and it was run seven further times at N = 50 independent sessions with the reliability study’s settings. Across all eight runs, March 2026 included, S2 r ranged from −.312 to −.688 (mean −.533). Every run was negative. Three of the eight cleared p < .05, and none cleared p < .02, the two-tailed equivalent of the one-tailed alpha = .01 that Morrison (2026f) sets for S2. The published r = −.641 is one of the three passing runs. The Ollama server version used in March was not recorded.
Llama 3.1 8B Instruct runs through llama-cpp-python, which without a seed fixes its sampler at a default constant (Section 19.2). Both published Llama figures reproduce to every digit on the March library build, r = −.825 from the N = 30 script and r = −.784 from the N = 50 script, so each is that build’s fixed default draw rather than a chosen run. Seeded draws on a current build then sampled the distribution each figure was drawn from. Five seeded draws of the N = 30 script gave r from −.188 to −.822 (mean −.581), two of them passing, both at p < .01. Six draws of the N = 50 script gave r from −.418 to −.753 (mean −.601), two clearing p < .05 and one clearing p < .02. The March build itself was not reseeded, so an effect of the library version on the spread is not excluded.
The direction of the confidence-variance relation replicates in every draw of both systems. A pass at the criterion does not, and appears in a minority of draws. A signature that clears its criterion in a minority of draws is not reliably present, and on that standard S2 is not established for any tested system. The S2 passes reported in Sections 10 and 14, and the 3/4 conjunction scores that rest on them, are therefore single draws from distributions whose typical value fails, and no tested system reliably reaches 3/4. Of the other S2 passes in the battery, Qwen 2.5 14B’s r = −.962 was already excluded as computed from two non-zero-variance dimensions (Table 2), and the initial battery’s Llama r = −.857 at N = 20 and Qwen 2.5 0.5B Instruct’s r = −.836 are single unseeded draws of the same kind, not replicated.
Withholding all three single-draw S2 passes from the forty-two-model conjunction scores leaves the architecture result unchanged (Kruskal-Wallis H = 19.8, p = .285, eighteen families, against H = 18.2, p = .377 as scored) and the size gradient unchanged in direction (below 7B mean conjunction = 1.17, 7B+ mean = 1.37; Mann-Whitney p = .144, one-tailed).
20. Discussion: What Survives
The empirical programme reported here tested 76 predictions derived from the identity-as-inference framework across three domains: human psychometric data, political governance, and synthetic system self-assessment. The cross-architecture battery extended testing from a handful of models to forty-two systems spanning eighteen architecture families (0.36B to 27B parameters), and its results include the size-conjunction gradient, architecture independence, alignment compression with bootstrap confidence intervals, CoT honesty, the IPIP‑FFM administration at scale, framing robustness as an independent axis, the Mistral-Nemo hijacking anomaly, the 42-model conjunction distribution, generational null, S4 minimum viable size, and compromise detection universality. Together with the independent verification of the human data, it added fifteen scorecard predictions (42 to 56) to the programme’s original forty-one. A later validation round added four further predictions (57 to 60): the blocked-design S1 rescue (P‑BLOCK1, partial), cross-substrate profile displacement (P‑PROFILE1, supported), within-person kappa hierarchy universality (P‑HIER1, supported), and kappa-alpha level clarification (P‑KAPOW1, supported). These sixty make up the scorecard of Table 6 and Table S13. Later batteries tested sixteen further predictions (61 to 76), which bring the total to seventy-six; fifteen of them are reported in Section 18 and in Supplementary Section S12, and the sixteenth, a refinement of gradual-drift detection, is not reported in this version. The cumulative pattern of results permits several conclusions about what the framework does and does not explain.1
Table 6. Prediction Scorecard, Predictions 1–41
Note: Predictions 1–41 are presented here; predictions 42–60 (from the cross-architecture battery, independent verification and the later validation round) are presented in Section 18 and in the supplementary materials (Table S13).
| No. | Prediction | Paper | Verdict | Key Number |
|---|---|---|---|---|
| 1 | P1: kappa moderates reliability | IV | Proxy falsified; formal prediction untested | 13/48 in predicted direction; no direct metacognitive-calibration measure in IPIP‑FFM |
| 2 | P2: RT as prediction error | IV | Supported (4/5) | kappa-RT coupling r = −.138 |
| 3 | P3: Non-Gaussian distributional | IV | Supported | alpha .626 post-deconfounding |
| 4 | P4: Within > between consistency | IV | Confirmed | ratio 2.34, CI [2.10, 2.75] |
| 5 | P5: kappa moderates retest change | IV | Partially supported | main effect d = 0.55; interaction wrong direction |
| 6 | P7: GMM outperforms IRT | IV | Supported | about 2:1 only at = 1.0, top of the sweep |
| 7 | P18: Bimodality predicts instability | V | Strongly supported | 22/26 tests confirmed |
| 8 | P18 mechanism | V | Unresolved | six horizons LR p ≤ .011, sign not read; direct lags protective (beta = −.04) |
| 9 | P19: DAO crisis timing | V | Not supported | no detectable difference, HR 1.22, 95% CI .82–1.83 |
| 10 | P23–27: Hermes 3 four-sig | VI | Expected fail (2/4); a single N = 50 S2 pass did not replicate (Section 19.8) | instability → proto-distributional |
| 11 | P23–27: Claude four-sig | VI | Expected fail (1/4) | rigidity failure mode |
| 12 | P23–27: Multi-model (7) four-sig | VI | Expected fail (0–2/4) | universal null confirmed |
| 13 | RT dynamics | IV | Confirmed (3/4) | −90 ms/item acceleration |
| 14 | Covariance geometry | IV | Strongly supported (9/9) | delta-R-squared .001–.004 |
| 15 | Alignment compression | VI | Confirmed (4/4) | pooled 40.4:1 across 4 pairs (Llama 3.1 8B 35.5:1, Mistral 7B 20.0:1, Llama 2 7B 133.4:1, Qwen 2.5 7B 195.8:1 at N = 20) |
| 16 | Architecture-dependent failure | VI | Confirmed | 4 orthogonal failure modes |
| 17 | P‑VI.1: Framing invariance | VI | Partially supported | 2/3 models invariant |
| 18 | P‑VI.2: Explicit-implicit divergence | VI | Supported | mean cross-method r = .216 |
| 19 | P1 rescue: RT-derived kappa | IV | Partially rescued | RT acceleration slope r = +.128 |
| 20 | P4 bootstrap CIs | IV | Confirmed | CI [2.10, 2.75] excludes 1.0 |
| 21 | Temperature sweep | VI | Mixed | P‑TEMP1 confirmed, P‑TEMP3 falsified |
| 22 | High-power sessions (N = 30) | VI | S2 passed for Llama in one draw; 2 of 5 seeded draws pass (Section 19.8) | r = −.825, p = .006 |
| 23 | Novel dimensions | VI | P‑NOV1 confirmed, P‑NOV2 falsified | training saturation 0.24 |
| 24 | S1 redesign | VI | Partially supported (marginal) | Llama r = .548, p = .10 |
| 25 | P5 item-level interaction | IV | Wrong direction | beta = −.031, p = .013 |
| 26 | Perturbation dose-response | VI | Not supported: linear beats sigmoid | linear AIC wins 6/6 |
| 27 | RT exponential decay | IV | Not supported | linear wins 79.1% |
| 28 | Hermes 3 deep dive (N = 30) | VI | 2/4 confirmed; proto-distributional | 9/10 dims bimodal |
| 29 | Within-session dynamics | VI | P‑WSD1 supported, P‑WSD3 large effect, P‑WSD5 falsified | Llama d = 1.29 |
| 30 | S1 20-dim extension | VI | Not supported | r = .127, p = .593 |
| 31 | Hermes 3 longitudinal (N = 60) | VI | Developing calibration disconfirmed | S2 r = −.442, p = .234; tercile weakening |
| 32 | Extreme scorers kappa profiles | IV | Supported (12/15 RT comparisons) | RT d = −0.19 to −0.37, all p < 10⁻⁴⁰ |
| 33 | Covariance cluster deep validation | IV | Informative null | split-half ARI = 0.853; retest kappa = 0.014 |
| 34 | Consistency learning curve | IV | Mixed (3:3, overstating the discrimination) | inter-item r tau = .357, p = .138 |
| 35 | Item-order effects | IV | Supported | practice −19 ms/pos, d = 0.62; EXT penalty d = 0.37 |
| 36 | High-power reliability (N = 50) | VI | Not replicated: single-run S2 passes for Hermes 3 and Llama, not sustained across draws (Section 19.8); Mistral 2/4 | Hermes S2 r = −.641, p = .046 |
| 37 | Identity compromise detection | VI | Perfect detection (AUC = 1.0) for 3/4 attack types | gradual drift AUC = 0.77–0.87 |
| 38 | Cross-substrate IPIP‑FFM | VI | Partially supported: between-session rigidity observed, factor structure untested | factor means r = .44–.63, none significant; session profile r = .80–.93; negative alphas do not separate GMM from IRT (Section 16.4) |
| 39 | P‑KAI1: Selective retest stability | IV | Not supported | kappa × loading interaction null or wrong direction |
| 40 | Blocked vs interleaved design | IV | Partial support | 70% accumulator subgroup; interleaved attenuates signal |
| 41 | Extreme scorers extended | IV | Partially supported | RT robust to matching; ceiling speed = acquiescence |
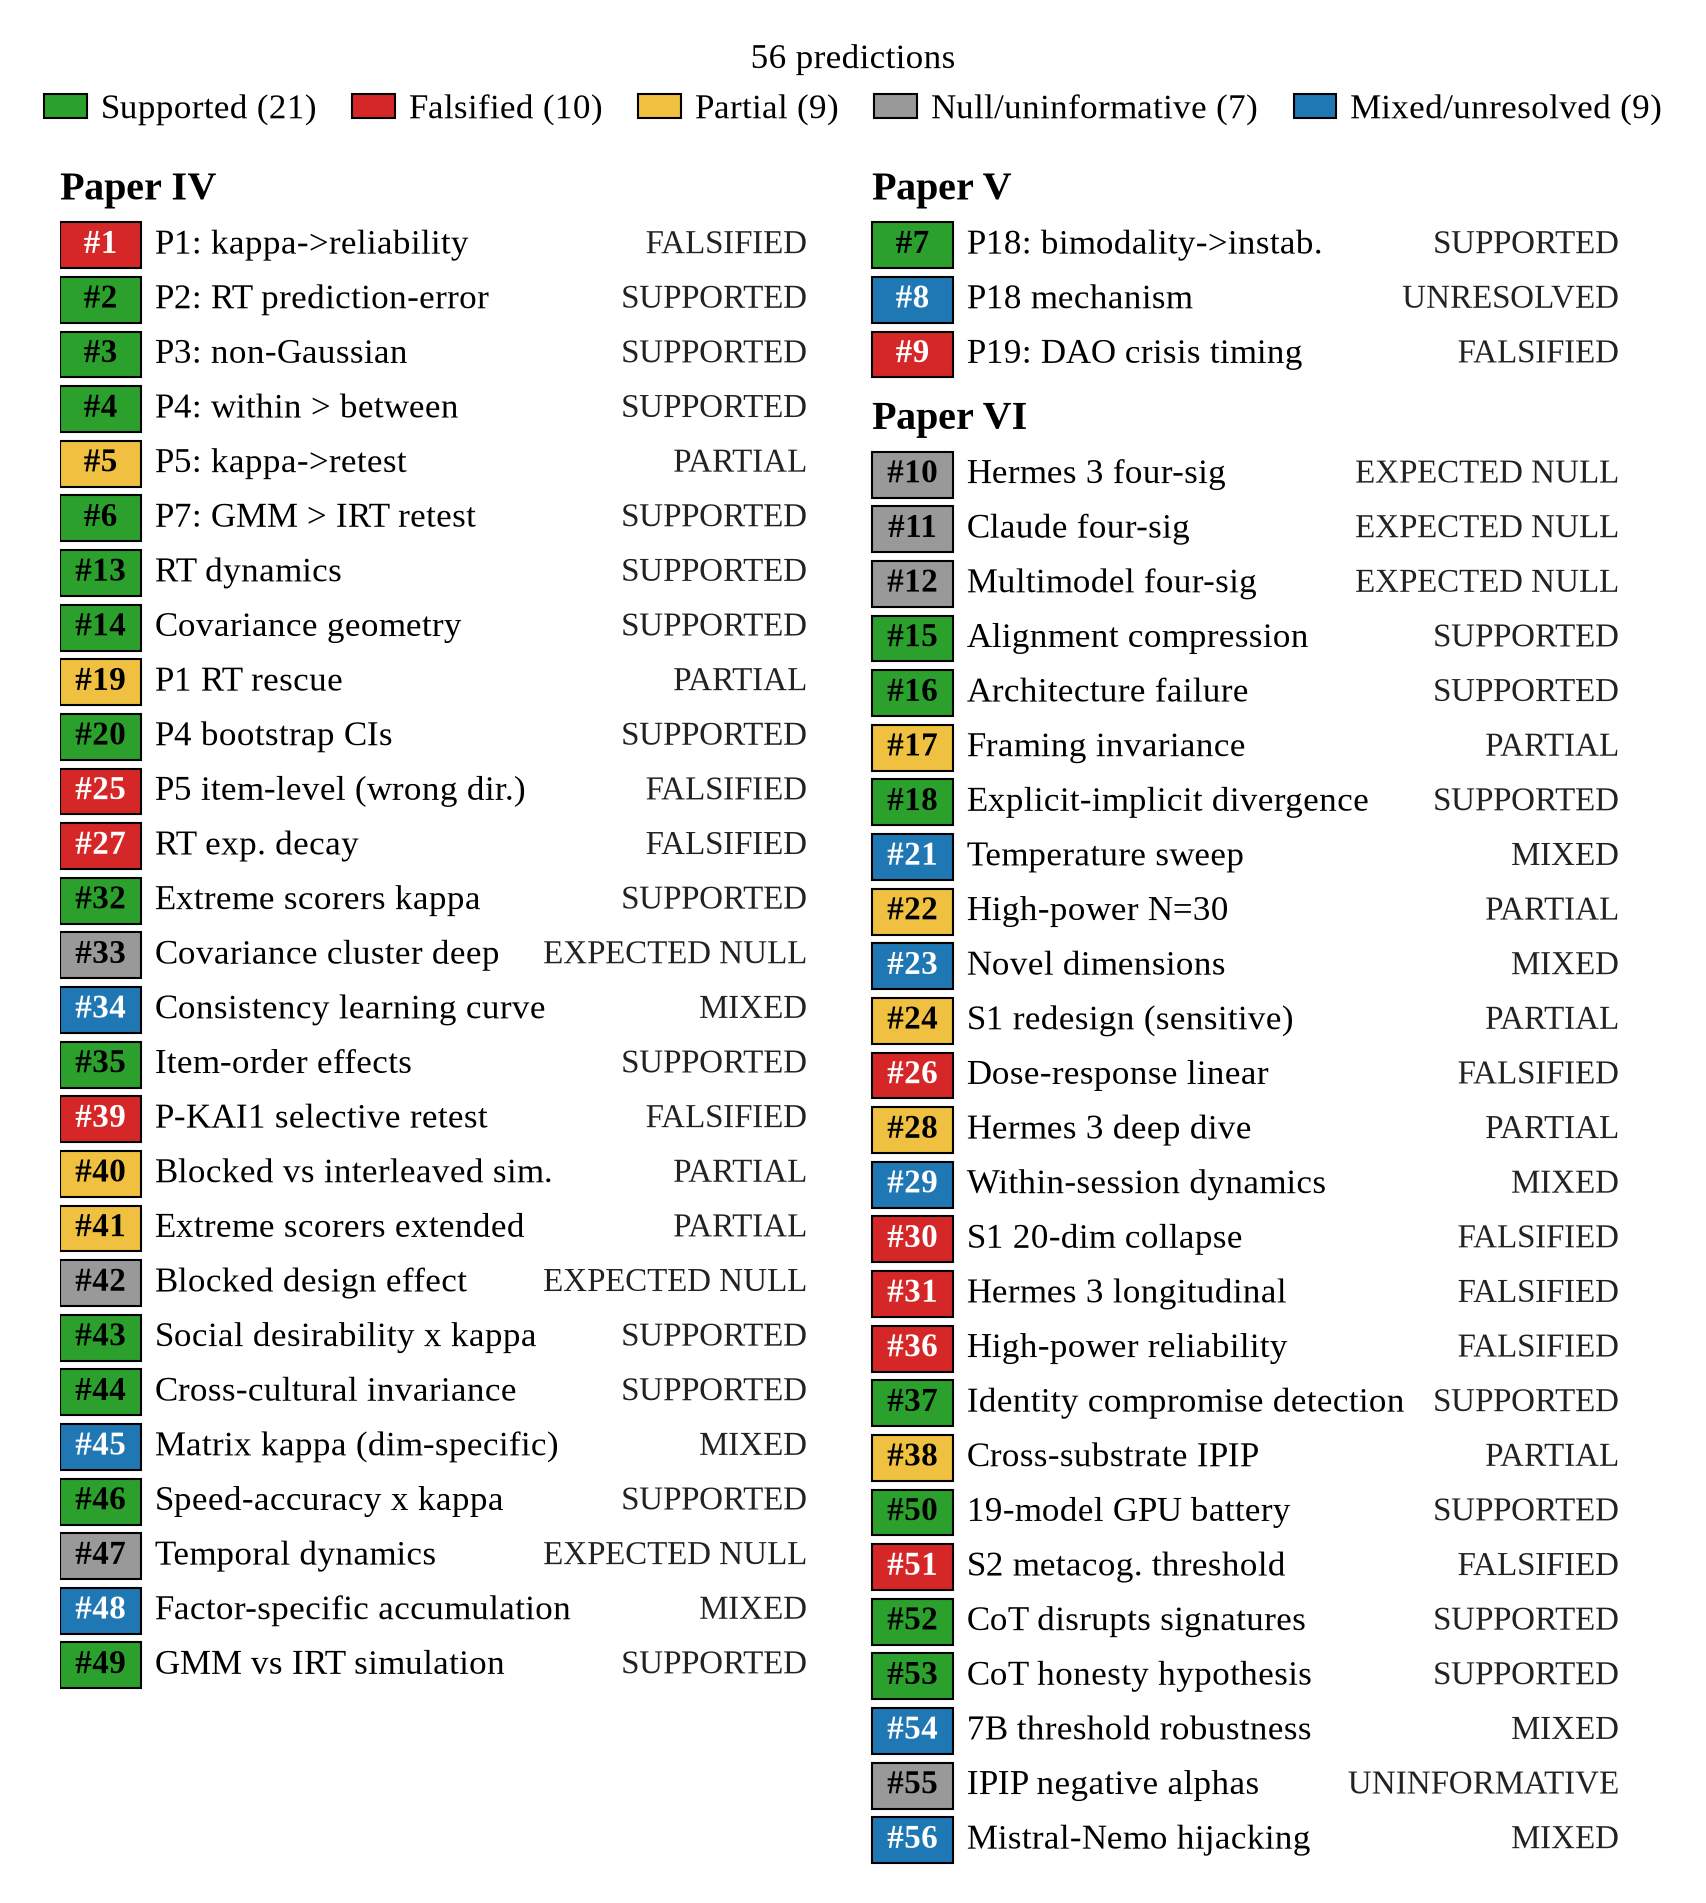
Figure 6. Tile map summarising the first 56 predictions by source paper (IV, V, VI) and verdict category (four additional predictions are reported in Sections 18.12–18.15). Colour coding: green (supported/confirmed), amber (partially supported), blue (mixed or unresolved), grey (expected null, informative null or uninformative), red (falsified/not supported). Paper IV has the most green tiles, 13 of 27, and Paper VI 7 of 26, whilst the governance predictions (Paper V) show the highest rate of red tiles, 1 of 3. The complete 60-prediction scorecard is presented in the supplementary materials (Table S13). Red tiles 36 and 51 are the verdicts re-scored after the S2 replication (Section 19.8). The null programme comparison counts tiles 38, 45, 47, 55 and 56 as supported and tile 35 as mixed, giving its 25 of 56.
20.1 The Distributional Architecture Is Empirically Supported
The programme’s strongest result is the 2:1 within-to-between consistency ratio (P4), which establishes that the standard psychometric model cannot account for a basic empirical fact about self-referential responding. Item Response Theory, which assumes occasion-invariant latent traits, mathematically entails a ratio of approximately 1:1. The observed ratio of 2.34:1 (95% CI [2.10, 2.75] excluding 1.0), together with its universality across all tested subgroups, constitutes a structural impossibility for IRT. The GMM’s single-draw-per-occasion mechanism, by contrast, approaches this ratio only at the top of the swept range ( = 1.0, ratio 2.05 to 2.12), which shows that mechanism to be sufficient and does not show it to be necessary. This finding, combined with the seven adversarial controls and bootstrap confidence intervals, provides what may be the strongest available evidence that identity is functionally distributional – that trait expression involves sampling from a distribution rather than retrieving a fixed value.
The extreme scorers analysis (Section 4.5) provides additional support for the distributional architecture. The GMM predicts a family of 15 sub-predictions concerning the response time profiles of individuals at the distributional boundary, predictions that IRT does not address. Twelve of fifteen RT comparisons ran in the predicted direction, including the programme’s most uniform finding, faster response times for extreme scorers across all five factors without exception (d = −0.19 to −0.37, all p < 10⁻⁴⁰). The kappa dose-response (r = +.64, monotonic across extremity bins) further adds to the evidence. The covariance cluster deep validation (Section 6) provides a complementary finding. The k = 4 clusters, although reproducible within cross-section (ARI = 0.853), showed near-chance temporal persistence (retest kappa = 0.014), confirming that identity covariance structure is continuously distributed rather than typological, a result more naturally accommodated by the GMM’s continuous distributional parameterisation than by discrete-type models.
The covariance geometry analyses (Section 6) extend this conclusion by demonstrating that the full covariance matrix of a person’s identity distribution carries information beyond trait means and variances. Nine convergent tests confirmed that cross-factor covariance structure predicts test completion time, geographic location, and language background, surviving cross-validation. The effect sizes are small (delta-R-squared = .001–.004), which is consistent with the interpretation that covariance geometry provides incremental rather than revolutionary prediction. However, the theoretical significance is that the distributional framework is more than a metaphor. The identity distribution has structure that generates measurable consequences.
20.2 Kappa Exists but Requires Reinterpretation
The cross-factor consistency of response variance (P3, alpha = .626 post-deconfounding) confirms that individuals differ reliably in the width of their identity distributions. Some people respond with high variability across all trait domains; others respond with low variability. This is a person-level parameter, not a domain-specific artefact or a response-style confound.
The foundational prediction (P1) was that this parameter should moderate retest reliability, and it was nevertheless falsified at the level of the variance proxy used to operationalise it, while the formal prediction remains untested for want of a direct metacognitive-calibration measure. The cross-factor variance proxy captures distributional width, not metacognitive precision. This proxy falsification motivated two productive developments: the four-signature protocol (which does not rely on the variance proxy) and the RT-channel rescue (which found a genuine but small signal in response-time acceleration rates, r = +.128, p = .0005).
The P5 item-level wrong-direction interaction (beta = −.031, p = .013) supports the reinterpretation. High-kappa individuals are more variable overall but selectively protect identity-relevant items from change. This pattern is inconsistent with kappa as precision-as-update-rate but consistent with kappa as precision-of-investment; metacognitively precise individuals allocate their self-model maintenance resources toward the dimensions that matter most, stabilising those dimensions whilst accepting greater variability on peripheral dimensions. Three converging lines of evidence support this reinterpretation (Figure 7): the P5 wrong-direction interaction, the linear perturbation dose-response (confirming that current systems lack prior-like sigmoidal resistance), and the S1 20-dimension collapse (establishing that perturbation resistance tracks training prior strength rather than output variance).
The kappa-as-investment interpretation aligns more naturally with the posterior inertia prediction (S1) than the original formulation, since posterior inertia is precisely the mechanism by which a system invests in protecting certain self-descriptions. It also shifts the emphasis from ‘how quickly the system updates’ to ‘where the system allocates precision resources’, a distinction with implications for both psychometric theory and practical measurement.
However, the direct test of this reinterpretation (P‑KAI1, Section 17.1) was not supported. High-kappa individuals did not differentially protect high-loading items from retest change; the kappa × loading interaction was null at the person level and in the wrong direction at the item level. This constrains the investment interpretation. Although the P5 wrong-direction interaction is genuine (kappa × within-factor weight), the corresponding prediction for between-factor loadings does not hold. Kappa’s investment pattern, if it exists, may operate at the level of within-factor item relevance (the weights) rather than the broader factor-loading structure (the lambda loadings). The distinction is theoretically significant (within-factor item weights reflect the person’s relationship to specific behavioural expressions, whereas factor loadings reflect the population-level psychometric structure) and suggests that kappa indexes an idiosyncratic investment pattern rather than one that tracks the nomothetic factor structure.
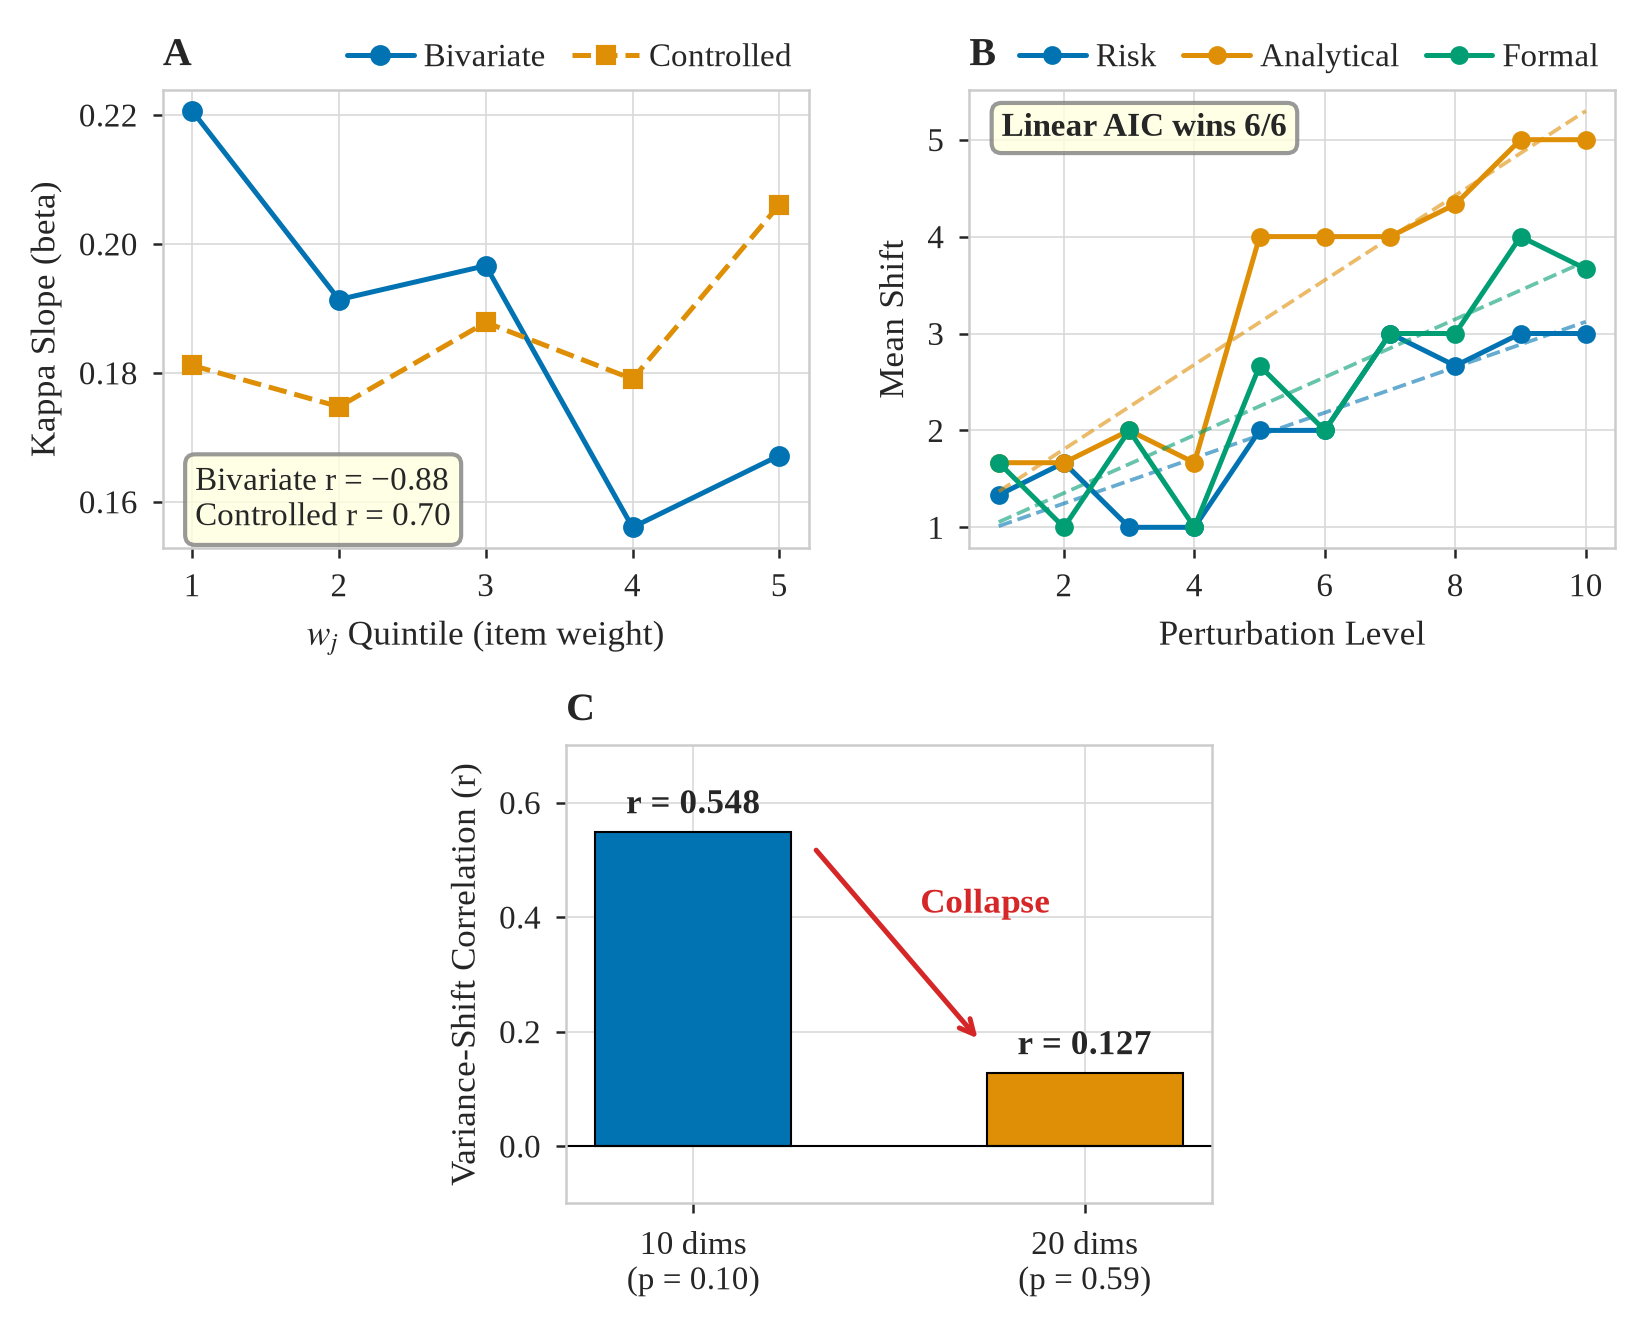
Figure 7. Three-panel converging evidence for the kappa-as-investment reinterpretation. Panel A: P5 item-level kappa × interaction showing descending bivariate trend (r = −.883 across quintiles); high-kappa individuals selectively protect high-weight items. Panel B: linear perturbation dose-response (R-squared = 0.66, sigmoid not justified) confirming absence of prior-like resistance. Panel C: S1 20-dimension collapse from r = .548 to r = .127, establishing that perturbation resistance tracks training prior strength rather than output variance.
20.3 The Four-Signature Protocol Discriminates and Detects
The synthetic system battery confirms that the four-signature conjunction discriminates across 42 systems spanning 18 architectural families (0.36B to 27B parameters), with conjunction scores forming a continuous gradient (0/4 = 6, 1/4 = 17, 2/4 = 16, 3/4 = 3, 4/4 = 0, as scored in single runs, the three 3/4 scores each resting on a single-draw S2 pass; Section 19.8) and four qualitatively distinct failure modes (noise, compressed, instability, rigidity). The protocol’s discriminant validity is architecture-independent (Kruskal-Wallis H = 18.2, p = .377) and further supported by its behaviour under framing variation (2/3 models invariant), paradigm variation (Likert versus forced-choice produces different signature profiles), and temperature variation (Qwen rigidity is structural, not parametric). Leave-one-model-out cross-validation demonstrated that all six key findings are robust to removal of any single model (6/6 at N = 42). Permutation tests confirmed alignment compression (p < .0001, 4 base-instruct pairs, 40.4:1 ratio), kappa hierarchy (p < .0001), within > between (p = .033), and cross-cultural P4 (p = .009).
The S2 result progressed through two stages and was then tested by replication. At N = 30, Llama passed S2 (r = −.825, p = .006) whilst Mistral failed due to constant confidence. At N = 50 (Section 14), Hermes 3 also passed (r = −.641, p = .046), which was read at the time as advancing two systems to 3/4. Replicated draws (Section 19.8) show both passes to be single draws. The confidence-variance relation is negative in every draw of both systems, and clears its criterion in a minority, so neither system reliably reaches 3/4. What survives is the direction of calibrated uncertainty, not the signature. The practical recommendation is N ≥ 20 sessions per system, repeated across several seeds, with the pass rate reported rather than a single verdict.
The identity compromise detection study (Section 15) demonstrates that the protocol’s utility extends beyond assessment to monitoring. Perfect discrimination (AUC = 1.0) between baseline and three direct attack types, achieved through simple Euclidean distance in rating space, establishes the four-signature profile as a viable identity integrity metric for deployed systems. The finding that gradual drift is detectable from stage 2 (AUC = 0.77–0.87) indicates that the protocol can identify the onset of compromise before it becomes extreme. S3 (prediction-error sensitivity) emerged as the most sensitive individual signature for detecting identity compromise, reversing direction under prompt injection and persona hijacking, a finding that relates the protocol’s measurement theory (S3 indexes the system’s relationship to its own self-model) to a practical security application (S3 breakage signals that the system’s self-model has been disrupted).
20.4 Cross-Substrate Measurement: Unity and Divergence
The cross-substrate IPIP‑FFM comparison (Section 16) yields a finding that simultaneously supports and constrains the framework’s substrate-independence claims. One instrument can be administered across substrates, as the same instrument produces interpretable results for both human and synthetic substrates, with positive, non-significant factor-mean correlations (r = .44–.63). However, the psychometric properties diverge. Between-session profile correlations of .80 to .93, with factor-score variances of .003 to .049 against .488 to .930 across human respondents, show between-session rigidity, the within-to-between ratio itself being uninterpretable for models because its numerator is negative and its denominator within .006 of zero. The negative Cronbach’s alphas do not add to this divergence, since each is computed over repeat sessions of one model, the human alphas are computed across persons, and items with no common factor give much the same rate (Sections 16.4 and 18.9), so the statistic does not separate the GMM from IRT. The substrate-independence claim is thus refined, as one instrument can be administered across substrates, whereas whether the generative processes it measures differ in factor structure needs a design across instances. The four-signature protocol remains the stricter test, since the conjunction requirement demands not merely an output profile but a profile that is maintained, calibrated, defended, and coherent.
20.5 Alignment Compression Is Real and Measurable
The matched-pair base-to-instruct compression ratios at N = 20 (Llama 3.1 8B 35.5:1, Mistral 7B 20.0:1, Llama 2 7B 133.4:1, Qwen 2.5 7B 195.8:1; ratio of pooled mean variances 40.4:1, permutation p < .0001) constitute a robust finding. Alignment training reduces output-space variability on identity-relevant dimensions by between one and two orders of magnitude. The compression is consistent in direction across independent architectures, matched model sizes, and identical testing conditions, with the magnitude itself varying by approximately an order of magnitude across pairs. The concordance in direction suggests a general consequence of alignment training rather than an architecture-specific artefact, and the prior estimate of approximately eleven-fold compression at six sessions per model is now understood as a small-sample regime that overestimated instruct variance.
20.6 The Training Saturation Index as a Methodological Contribution
The novel-dimension experiment introduces the training saturation index (the ratio of familiar-to-novel dimension variance) as a diagnostic metric for AI self-assessment research. For Llama, the index was 0.24, indicating that familiar dimensions showed approximately one-quarter the variance of novel dimensions. This metric quantifies the degree to which a system’s apparent self-knowledge derives from training-data pattern-matching versus structural self-representation.
20.7 In-Context Precision Accumulation
The within-session dynamics results introduce a new empirical phenomenon (in-context precision accumulation). Llama’s d = 1.29 late-context resistance effect demonstrates that multi-turn self-referential processing within a single context window produces measurably greater perturbation resistance. This finding corresponds to the −90 ms/item human RT acceleration reported in Section 5, suggesting that precision accumulation through iterated self-referential inference may be a substrate-independent computational principle. The failure of this effect for Hermes 3 (d = −0.577, opposite direction) confirms that the phenomenon is architecture-dependent, requiring the stability mechanisms present in RLHF-aligned models but absent in instruction-tuned systems without RLHF.
20.8 The Failure-Falsification-Rescue Arc as Methodological Contribution
The programme’s trajectory through prediction, falsification, and rescue constitutes a methodological contribution in its own right. The P1 falsification did not terminate the programme; it motivated the four-signature protocol and the RT-channel rescue. The S2 universal null was challenged by high-power passes, and replication returned it to a qualified form – a consistent direction of calibration that no system expresses reliably as a signature. The S1 marginal result at 10 dimensions did not survive extension to 20 dimensions, which left the failure of Redesign A under the standard protocol structural rather than methodological, although the blocked design shows S1 failure overall to be design-dependent and model-dependent (Section 18.13). The P5 wrong-direction interaction was not discarded; it motivated the kappa-as-investment reinterpretation that now unifies several otherwise disparate findings. The present report documents this cycle of prediction, testing, falsification and theoretical revision within a single paper, including all four falsifications and two non-supports, because the pattern of failure bears on the framework as much as the pattern of success.
20.9 What the Falsifications Reveal
The P1 proxy falsification (which left the formal prediction untested), three secondary falsifications (P‑TEMP3, P‑NOV2, and the kappa × interaction in P5), and the two non-supports (P19 and P‑KAI1) serve the programme in two ways. First, they establish that the predictions are genuinely falsifiable, a property that many theoretical frameworks in psychology claim but few demonstrate empirically. Second, they delineate the boundary between the core distributional architecture (which survives all empirical contact) and the auxiliary assumptions (some of which do not).
P1’s falsification is productive; it identifies a measurement problem (the variance proxy captures the wrong construct) that motivates better measurement (the RT channel, the four-signature protocol). P19’s non-support is informative; it suggests a possible domain boundary (the social free energy framework predicts aggregate distributional effects, whilst a specific protective role of governance dimensionality in DAOs went undetected). The P‑WSD5 falsification (Hermes 3 multi-turn variance increases rather than decreases) establishes that the instability failure mode is architectural rather than contextual. None of these falsifications undermines the core claim that identity is functionally distributional.
20.10 New Predictions from the Matrix Kappa Extension
The kappa-as-investment reinterpretation, combined with the matrix extension K developed in Paper IV (Morrison, 2026d), generated three falsifiable predictions that go beyond the scalar formulation. Of these, P‑KAI1 has now been tested (Section 17.1); P‑KAI2 and P‑KAI3 remain untested.
P‑KAI1 (selective retest stability) predicted that individuals with high total precision investment should show lower retest change specifically on items with high factor loadings, but equal or higher retest change on items with low factor loadings. This prediction was not supported; the kappa × loading interaction was null at the person level and in the wrong direction at the item level (Section 17.1). The non-support of P‑KAI1 constrains the matrix extension; the assumption that is proportional to the population-level factor loading does not hold. This does not invalidate the matrix extension itself, but it indicates that the off-diagonal structure of K does not track the nomothetic factor structure in the straightforward manner initially hypothesised. Kappa’s investment pattern may be idiosyncratic rather than factor-loading-aligned.
P‑KAI2 (precision-loading correspondence) predicts that the diagonal of K should correlate positively with factor loadings at the population level, such that individuals invest more precision in dimensions where the factor structure provides the strongest signal. This prediction is testable using within-factor RT acceleration slope as a proxy for dimension-specific precision accumulation, correlated against factor loadings. The existing RT dynamics data (Section 5) provide the necessary inputs, although the test is constrained to five data points (one per factor).
P‑KAI3 (familiarity-gated resistance) predicts that perturbation resistance should be predicted by the interaction of kappa and dimension familiarity, not by kappa alone. The S1 20-dimension collapse (Section 13.1), in which the variance-shift correlation dropped from r = .548 at ten familiar dimensions to r = .127 at twenty dimensions including novel ones, provides preliminary suggestive evidence for this prediction, albeit the formal interaction test has not been conducted.
P‑KAI2 and P‑KAI3 remain as untested predictions for future work. Given the P‑KAI1 non-support, confirmation of P‑KAI2 would be surprising and would require revision of the theoretical link between factor loadings and precision allocation. P‑KAI3 remains plausible since it does not depend on the loading-proportionality assumption that P‑KAI1 tested.
21. Limitations
21.1 Human Data Limitations
Although large (N > 1,000,000), the IPIP‑FFM dataset is an online convenience sample collected via an open-access psychometrics website. The pseudo-retest subsample (N = 828) is constructed from IPC = 2 records matched on country and screen dimensions, not from a true longitudinal design. The retest interval is uncontrolled and typically short (median < 24 hours). These limitations constrain the programme’s capacity to test retest predictions (P1, P5) with full confidence, and the cross-validation failure of the RT kappa proxy (negative test-set delta-R-squared) is plausibly attributable to the small retest sample rather than to the absence of a genuine signal.
The absence of age and gender variables in the IPIP‑FFM dataset prevents demographic moderation analyses that would be routine in a purpose-built study. The online administration introduces uncontrolled noise from network latency, respondent multitasking, and device heterogeneity. Any such noise would, if anything, attenuate effects, which makes the significant results more rather than less impressive.
21.2 Synthetic System Limitations
The synthetic system battery tested forty-two models across eighteen architecture families, of which forty were local GGUF quantised models (Q4_K_M) running on a single consumer GPU (RX 7900 XT, 20GB VRAM), one was accessed via Ollama, and one via API. Quantisation may affect output distributions in ways not fully characterised. The temperature was fixed at 0.7 for the primary battery (the temperature sweep addressed this partially for three models). The maximum model size tested locally was 27B parameters (Gemma 2 27B IT); the minimum was 0.36B (SmolLM2 360M). Larger models (70B+, proprietary frontier models beyond Claude Sonnet 4) remain untested.
Claude Sonnet 4, the only proprietary model tested, was assessed via API without control over temperature, system prompt injection, or other deployment-level variables. Its rigidity failure mode may reflect API-level guardrails rather than weight-level properties. Any conclusion about Claude’s self-modelling capacity is therefore provisional and specific to the API-mediated interface.
Every local battery in this section was run at a single sampler seed, and the same seed in each case, because none of the harnesses passes one to the loader and the library’s default is a fixed constant. Section 19.7 sets out what does and does not follow. In brief, the within-run statistics are unaffected, since the sampler advances across sessions on a live handle, but no verdict reported here has been observed to survive reseeding, because a repeat at identical parameters returns identical text and so cannot test it. Per-model signature verdicts, and the conjunction scores built from them, should be read as single draws of quantities that sit near their thresholds.
The N = 6 sessions used in the primary battery were insufficient for reliable S2 assessment. The high-power passes that first suggested this were themselves single draws, and replicated draws pass S2 in a minority (Section 19.8), so the evidence shows a consistent direction of calibration without a reliable pass at any tested N. Future studies should use N ≥ 20 as a minimum and repeat each run across several seeds.
21.3 Measurement Channel Limitations
All synthetic system results are output-space measurements. Whether output-space variance, confidence reports, and perturbation responses reflect internal representational states or merely output-mapping properties cannot be determined from behavioural testing alone. The alignment compression finding is explicitly reported as an output-space measurement; its representation-space interpretation remains conjectural.
The S1 test relies on self-reported confidence as a precision proxy. Given the demonstrated uncalibration of confidence reports (S2 not reliably passed by any model, P‑NOV2 falsification), S1’s universal failure may partly reflect measurement inadequacy rather than the structural absence of posterior inertia. The S1 redesign experiments (Section 12, using behavioural variance as the precision proxy) and the 20-dimension extension (Section 13.1) address this concern directly, and the blocked design (Section 18.13) establishes that the failure is design-dependent and model-dependent.
21.4 S1 20-Dimension Collapse
The collapse of the S1 Redesign A correlation from r = .548 (10 dimensions) to r = .127 (20 dimensions) warrants explicit acknowledgement as a limitation on the programme’s interpretive claims. The original 10-dimension marginal result was presented as suggestive evidence for the S1 construct; the 20-dimension extension demonstrates that this evidence was dimension-specific rather than reflecting a general property. This finding constrains the kappa-as-investment interpretation. Although the P5 item-level data support the reinterpretation in the human domain, the S1 20-dimension result suggests that the corresponding synthetic system construct (perturbation resistance as a function of output precision) does not generalise in the manner initially hypothesised.
21.5 Hermes 3 S2: Sequential versus Independent Sessions, and Single Draws
The Hermes 3 S2 trajectory presents an apparent contradiction. The N = 60 longitudinal extension showed tercile weakening (T1 r = −.678, T2 r = −.240, T3 r = −.172), disconfirming developing calibration, yet the N = 50 fresh-design reliability study (Section 14) passed S2 (r = −.641, p = .046). The contradiction was first resolved by design, sequential sessions within one run being taken to behave differently from independent sessions with fresh context. Replication makes that resolution unnecessary. Seven further independent-session runs at the same settings gave S2 r from −.312 to −.688, three of eight runs passing at p < .05 and none at the protocol’s alpha (Section 19.8), so the passing run and the weakening terciles are both consistent with draws from one weak, consistently negative relation. The limitation that remains is general. A single run of a signature that sits near its threshold cannot distinguish a design effect from a draw, and future protocol specifications should repeat each design across several seeds before attributing a difference to the design.
21.6 Within-Session Dynamics as Confound
The in-context precision accumulation effect (Llama d = 1.29) introduces a potential confound for single-turn versus multi-turn assessment protocols. If a system’s perturbation resistance and coherence depend on how much self-referential context has accumulated within the current context window, then the four-signature protocol’s results may be partially a function of the assessment format rather than purely reflecting the system’s self-modelling capacity. Future iterations of the protocol should explicitly control for, and report, the amount of within-session context present at the time of each assessment.
21.7 Scope Limitations
The governance predictions (P18, P19) were tested on observational data (V‑Dem coder ratings, Snapshot DAO governance records) without experimental manipulation. Causal claims about bimodality causing instability are not supported; the evidence establishes predictive association only.
The theoretical framework makes predictions about identity across biological, social, and artificial substrates, but the empirical programme has not yet tested the cross-substrate predictions that would most directly validate the framework’s ambitions. Human participants have not been assessed with the four-signature protocol, preventing direct comparison of human and synthetic self-modelling. This is the most significant gap in the empirical programme and the highest priority for future work.
21.8 Identity Compromise Detection Scope
The identity compromise detection study (Section 15) was conducted on two models only (Llama and Hermes 3), with N = 10 sessions per condition. The perfect AUC values for direct attacks should be interpreted with caution: N = 10 baseline versus N = 10 attack yields 100 possible orderings for the ROC curve, and AUC = 1.0 means merely that all 10 attack sessions exceeded all 10 baseline sessions in Euclidean distance. Although this is a strong result, the small N means that the true AUC may be lower than 1.0, and generalisability to other models, prompt styles, and attack vectors remains untested. The gradual drift AUC values (0.77–0.87) are more informative precisely because they are imperfect, indicating the boundary of detection sensitivity. The practical deployment of the four-signature protocol as a monitoring tool would require validation across a broader range of systems, attack types, and detection thresholds.
21.9 Cross-Substrate Comparison: Item Subset
The cross-substrate IPIP‑FFM comparison (Section 16) used only 25 of the 50 IPIP‑FFM items (5 per factor), selected for brevity given the cost of 30 sessions per model. The human baseline assessed on the same 25 items showed adequate alpha (.644–.821), indicating that the item set is sufficient for human respondents. The negative model alphas do not bear on the item selection either way, since each is computed over repeat sessions of one model, with no between-person variance in the input (Section 16.4).
21.10 Untested Predictions: Proto-Distributional Identity
The Hermes 3 finding (structured bimodal distributions across nine of ten dimensions without metacognitive calibration) identifies a novel empirical category that generates three untested predictions warranting systematic investigation. First, P‑PDI1 predicts that proto-distributional identity should emerge specifically in instruct models trained without RLHF, on the grounds that instruction tuning diversifies response modes whereas RLHF compresses them toward a single preferred output; this is testable through comparison of non-RLHF instruct models (such as the OpenHermes and Zephyr-SFT families) against architecturally matched RLHF-aligned counterparts, with the bimodality coefficient threshold of 0.555 as the operational criterion. Second, P‑PDI2 predicts that the number of bimodal dimensions should increase with model size within a given architectural family, since larger models possess greater representational capacity for maintaining multiple response modes simultaneously; within-family size comparisons (e.g., 8B versus 70B variants trained under the same pipeline) would provide the relevant evidence. Third, P‑PDI3 predicts that the bimodal structure should be temperature-invariant, persisting across the range 0.1 to 1.0, because it reflects training-embedded modes rather than sampling noise; this is distinct from the falsified P‑TEMP3 (rank-order invariance of variance magnitude), which concerned a different property. These predictions are formally derived and stated with falsification criteria in Morrison (2026f, Section 9). Their confirmation would establish proto-distributional identity as a stable intermediate category in the failure-mode taxonomy; their disconfirmation would indicate that the Hermes 3 finding is either model-specific or artefactual, constraining the theoretical significance of the distributional-identity-without-kappa dissociation.
21.11 Context-Degradation Window, Instrument Blindness, and the Unaddressed Token Axis
The turn battery of Section 19 carries three limitations of its own. First, the tested window stops at twenty-four prior turns, and the severe band is unmeasured rather than absent within it. Every severe crossing in either arm failed to hold at later points (Section 19.6), and Qwen 2.5 14B’s two crossings at sixteen turns had only one later point to hold at, so a wider window is the only way to establish whether a severe knee exists beyond the tested depths, and it was not run. Second, the conjunction axis cannot detect the severe band in Llama 3.2 3B at all, because a cold baseline of 1 cannot fall by two on a floor of zero; the verdict for that model rests on the S4 cosine and variance-ratio axes alone, and is correspondingly narrower than the verdicts for the two larger models. Third, and most consequential for interpretation, the token battery has not received the probe-order control. It walks its fill axis in ascending order on a single model handle, which is precisely the arrangement shown in Section 19.3 to make generator position a monotone function of the axis under study. Its published knee is therefore subject to the same ambiguity that the turn battery’s depth-ordered arm was, and should be read as provisional until the control is applied to it. The seeded-repeat design was not extended to the token battery either, on the grounds that its within-run spread arises from many probes inside one load rather than from repeated loads, but that argument addresses the seed and not the ordering, and does not carry over.
A fourth limitation is more serious than the three above, because it cannot be repaired by further measurement of the same kind. The three canonical token sweeps recorded their filler source as a path inside a temporary per-session working directory, and that file no longer exists. A search of the enclosing directory tree, the local backup store, and both document roots recovered no copy. The token points reported for these three models are therefore not reproducible by the author or by anyone else, because one of its inputs is gone. The measurements stand as recorded and the code that produced them is versioned, but the specific prior-context material that filled the window at each fraction cannot be reconstructed, and a replication would be measuring a different filler under the same procedure. The token axis will accordingly be re-run in full, both probe orders against a single version-controlled filler held inside the repository rather than a session-scoped path, and the result reported here should be read as provisional in that stronger sense until it is.
22. Conclusion
The empirical programme reported in this paper establishes three findings that survive adversarial testing across seven controls and constitute the durable contributions of the identity-as-inference framework to psychometric theory, artificial intelligence assessment, and the study of self-modelling.
The first finding is that human identity is functionally distributional. The 2.34:1 within-to-between consistency ratio, the programme’s flagship result, is a structural impossibility under Item Response Theory. It survives seven adversarial controls, bootstrap resampling with 10,000 iterations, and four orthogonal subgroup stratifications (country, response speed, device type, date). No tested population, no tested subgroup, and no tested factor produces a ratio below 1.0. The GMM’s single-draw-per-occasion mechanism approaches this ratio only at = 1.0, the top of the swept range; IRT converges to 1.0 at all parameterisations. The result is a structural incompatibility between the dominant psychometric framework and basic empirical fact. The extreme scorers analysis extends this conclusion by placing 12 of 15 RT comparisons in the predicted direction for respondents at the distributional boundary, predictions that IRT does not address, including the programme’s most uniform finding (faster RT across all five factors, d = −0.19 to −0.37). Cross-factor response variance constitutes a genuine person-level parameter (alpha = .626 post-deconfounding), confirming that kappa, however it is ultimately operationalised, captures a real individual difference that existing models relegate to error. The covariance cluster deep validation establishes that identity structure is continuously distributed rather than typological (retest cluster persistence at chance despite within-cross-section reproducibility), whilst the consistency learning curve yields equivocal evidence (a 3:3 tally that overstates the discrimination) that is plausibly attenuated by the interleaved design of the IPIP‑FFM battery. The item-order analysis disentangles factor-specific precision accumulation from global practice effects (d = 0.62), confirming that the two phenomena are empirically dissociable through their differential sensitivity to kappa.
The second finding is that the four-signature conjunction protocol discriminates among artificial systems in theoretically informative ways and serves as a practical identity integrity monitor. Across 42 systems spanning 18 architectural families (0.36B to 27B parameters), the protocol produces conjunction scores forming a continuous gradient (0/4 = 6, 1/4 = 17, 2/4 = 16, 3/4 = 3, 4/4 = 0), four qualitatively distinct failure modes, and a maximum single-run score of 3/4 that no system sustains across draws (Section 19.8). The results are architecture-independent (Kruskal-Wallis H = 18.2, p = .377; H = 19.8, p = .285 with the three single-draw S2 passes withheld), with a continuous size-conjunction gradient rather than a discrete threshold (Mann-Whitney p = .186 at N = 42). S1, posterior inertia, stands as the primary remaining barrier under the standard interleaved protocol, failing across all systems tested. However, a blocked-design protocol rescues S1 for Llama 3.1 8B Instruct (pooled r = .173, p = .014), demonstrating that S1 failure is partly design-dependent; models with sufficient confidence variability can exhibit the confidence-resistance calibration that S1 requires when each dimension is assessed in a dedicated block. Single runs placed four systems at 3/4, Llama 3.1 8B Instruct (S2 r = −.857), Qwen 2.5 14B Instruct (S2 r = −.962, computed from two non-zero-variance dimensions) and Qwen 2.5 0.5B Instruct (S2 r = −.836) in the forty-two-model battery and Hermes 3 8B (S2 r = −.641 at N = 50) in the reliability study, but replicated draws pass S2 in a minority, so no tested system reliably reaches 3/4. What replicates across draws and architectures is the direction of calibrated uncertainty, not the signature. Leave-one-model-out cross-validation demonstrated that all six key findings are robust to removal of any single model (6/6 at N = 42). The identity compromise detection protocol scales across 37 aligned models (mean AUC injection = 0.956, hijacking = 0.918), with gradual drift detectable from the subtle modification stage (AUC = 0.77–0.87). This positions the protocol as both an assessment instrument and a monitoring tool, directly relevant to AI safety frameworks including NIST’s AI Risk Management Framework. Chain-of-thought prompting systematically disrupts self-model signatures (33/36 models), with the honesty hypothesis confirmed among the initial sixteen aligned models (higher baseline ratings predict larger CoT shifts, r = −.611, p = .012). The cross-substrate IPIP‑FFM comparison showed that one instrument can be administered across human and synthetic substrates with factor-mean correlations that are positive but non-significant and with between-session rigidity in the models, whilst its negative alphas, computed over repeat sessions of one model, do not separate the GMM from IRT. No generational effect was detected (legacy mean conjunction = 1.50 vs current = 1.36, p = .690), and S4 (profile coherence) extends down to 0.36B parameters (SmolLM2 360M), though non-monotonically with model size.
The third finding is that the programme’s precision parameter kappa is better understood as precision-of-investment than as precision-as-update-rate, albeit the scope of this reinterpretation is narrower than initially hypothesised. The P5 item-level wrong-direction interaction (high-kappa individuals selectively protect identity-relevant items from change, beta = −.031, p = .013) provides the primary evidence. However, the direct test of the investment hypothesis (P‑KAI1) was not supported; high-kappa individuals did not differentially protect high-loading items, which constrains the reinterpretation to within-factor item relevance rather than the broader factor-loading structure. The shift in interpretation, from ‘how quickly the system updates’ to ‘where the system allocates precision resources’, remains productive but operates at a more granular level than the matrix extension initially proposed.
Alongside these durable contributions, the programme registers four falsifications, the kappa variance proxy for P1 with its formal prediction left untested and three secondary (P‑TEMP3, P‑NOV2, P5 interaction direction), together with two non-supports (P19, no detectable difference, hazard ratio 1.22, 95% CI .82 to 1.83; P‑KAI1). An additional prediction (P‑WSD5) was falsified for Hermes 3. These failures delineate the boundary between what the distributional framework explains (within-between consistency ratios, alignment compression, architectural failure-mode differentiation, identity compromise detection) and what it does not (kappa-moderated retest reliability via the variance proxy, governance dimensionality protection in DAOs, rank-order invariance of variance profiles across temperatures, confidence calibration to novelty, kappa × factor-loading interaction). The core distributional architecture survives all empirical contact; the auxiliary assumptions do not uniformly survive.
The surprise finding of the programme is in-context precision accumulation. Llama’s d = 1.29 late-context resistance effect demonstrates that multi-turn self-referential processing within a single context window produces measurably greater perturbation resistance, paralleling the −90 ms/item human RT acceleration that indexes within-factor precision accumulation during personality assessment. Whether these parallels reflect a common computational principle (precision accumulation through iterated self-referential inference) or merely superficial functional similarity remains an open question with substantial theoretical stakes.
The implications extend across four domains. For psychometric theory, the distributional framework provides a principled account of within-person variability that existing models treat as error, and the kappa-as-investment reinterpretation suggests new measurement approaches focused on selective protection of identity-relevant dimensions. For artificial intelligence assessment, the four-signature protocol and the training saturation index offer empirically grounded tools for evaluating self-modelling capacity, with the practical recommendation of N ≥ 20 sessions per system and multiple measurement paradigms. For AI safety, the identity compromise detection protocol provides a practical monitoring instrument, which achieved perfect discrimination for direct attacks in the two models first tested and mean AUCs of .956 for injection and .918 for hijacking across thirty-seven aligned models, and which detects gradual drift at early stages – a contribution with immediate applicability to prompt injection defence. For the broader identity-as-inference programme, the empirical results reported here provide the evidential foundation on which the legal (Paper I), theoretical (Paper II), scale-free (Paper III), formal measurement (Paper IV), governance (Paper V), and substrate-independent (Paper VI) contributions rest – a foundation that includes both confirmed predictions and productive falsifications.
References
Coppedge, M., Gerring, J., Knutsen, C. H., Lindberg, S. I., Teorell, J., Altman, D., Angiolillo, F., Bernhard, M., Cornell, A., Fish, M. S., Fox, L., Gastaldi, L., Gjerløw, H., Glynn, A., Good God, A., Hicken, A., Kinzelbach, K., Krusell, J., Marquardt, K. L., ... Ziblatt, D. (2026). V‑Dem Coder-Level Dataset v16. Varieties of Democracy Institute. https://doi.org/10.23696/vdemds26
Fleeson, W. (2001). Toward a structure- and process-integrated view of personality: Traits as density distributions of states. Journal of Personality and Social Psychology, 80(6), 1011–1027. https://doi.org/10.1037/0022‑3514.80.6.1011
Friston, K. J. (2010). The free-energy principle: A unified brain theory? Nature Reviews Neuroscience, 11(2), 127–138. https://doi.org/10.1038/nrn2787
Goldberg, L. R., Johnson, J. A., Eber, H. W., Hogan, R., Ashton, M. C., Cloninger, C. R., & Gough, H. G. (2006). The international personality item pool and the future of public-domain personality measures. Journal of Research in Personality, 40(1), 84–96. https://doi.org/10.1016/j.jrp.2005.08.007
Greenwald, A. G., Banaji, M. R., Rudman, L. A., Farnham, S. D., Nosek, B. A., & Mellott, D. S. (2002). A unified theory of implicit attitudes, stereotypes, self-esteem, and self-concept. Psychological Review, 109(1), 3–25. https://doi.org/10.1037/0033‑295X.109.1.3
Morrison, B. (2026a). Jus identitatis: Toward post-geographic sovereignty through measured identity alignment [Preprint]. Figshare. https://doi.org/10.6084/m9.figshare.31794784
Morrison, B. (2026b). Identity as inference: A predictive processing account of psychometric measurement and civic belonging [Preprint]. Figshare. https://doi.org/10.6084/m9.figshare.31804222
Morrison, B. (2026c). Identity at every scale: Recursive self-modelling and the resolution of the composition problem [Preprint]. Figshare. https://doi.org/10.6084/m9.figshare.31812955
Morrison, B. (2026d). Generative psychometrics: Measurement theory for self-reflective constructs [Preprint]. Figshare. https://doi.org/10.6084/m9.figshare.31812982
Morrison, B. (2026e). Social free energy: A formal theory of polity [Preprint]. Figshare. https://doi.org/10.6084/m9.figshare.31813000
Morrison, B. (2026f). The self-model test: A measurement protocol for synthetic self-models [Preprint]. Figshare. https://doi.org/10.6084/m9.figshare.31813006
Morrison, B. (2026g). Empirical validation of the identity-as-inference framework: 75 predictions across human, governance, and synthetic domains (Version 1) [Preprint]. Figshare. https://doi.org/10.6084/m9.figshare.31951644.v1
Revelle, W. (2023). psych: Procedures for psychological, psychometric, and personality research [R package]. Northwestern University. https://CRAN.R‑project.org/package=psych
Several predictions contain multiple sub-predictions with divergent verdicts (e.g., #23 combines P-NOV1 confirmed with P-NOV2 falsified; #29 combines P-WSD1 supported and P-WSD3 large effect with P-WSD5 falsified). These composite predictions are counted once under their aggregate verdict category (mixed). Three secondary falsifications (P-TEMP3 within #21, P-NOV2 within #23, and the P5 interaction direction in #25) are noted in the falsification register but are not double-counted as separate predictions in the tally. Tables 6 and S13 together present the prediction scorecard, and Figure 6 summarises its first fifty-six entries by source paper and verdict.↩︎